Fig. 1.
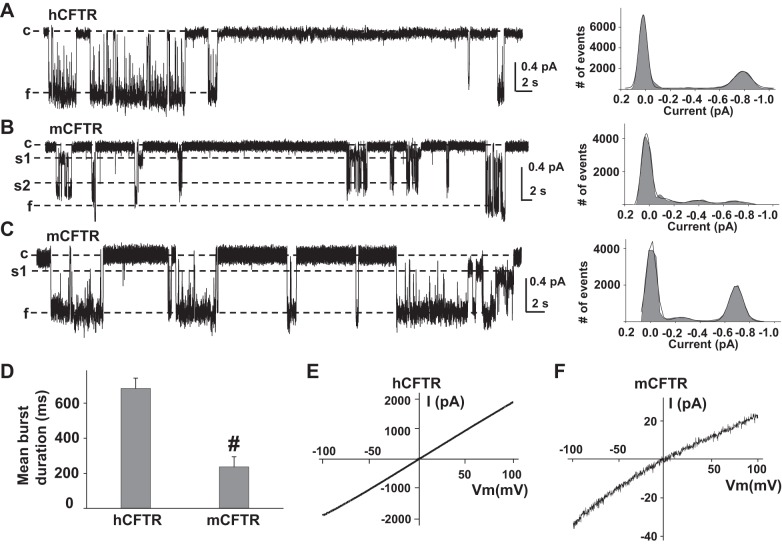
Human CFTR (hCFTR) and murine (mCFTR) differ in single-channel behavior. Representative single-channel current traces are shown for hCFTR (A) and mCFTR (B and C), along with their all-points amplitude histograms, from inside-out membrane patches excised from Xenopus oocytes, with symmetrical 150 mM Cl− solution in the presence of 1 mM MgATP and 127.6 U/ml PKA. All traces were recorded at VM = −100 mV. c, Closed state; s1, subconductance state 1; s2, subconductance state 2; f, full open state. Solid lines in histograms are fit results to a Gaussian function. D: mean burst durations of hCFTR (n = 5 patches) and mCFTR (n = 8 patches). #P < 0.001 compared with hCFTR. For mCFTR, we considered a transition from c to any open level (s1, s2, or f) as an opening. Representative current-voltage (I–V) curves of hCFTR (E) and mCFTR (F) recorded in symmetrical 150 mM Cl− solutions with the inside-out macropatch technique by using the ramp protocol as described in materials and methods; n = 8 for both hCFTR and mCFTR.

