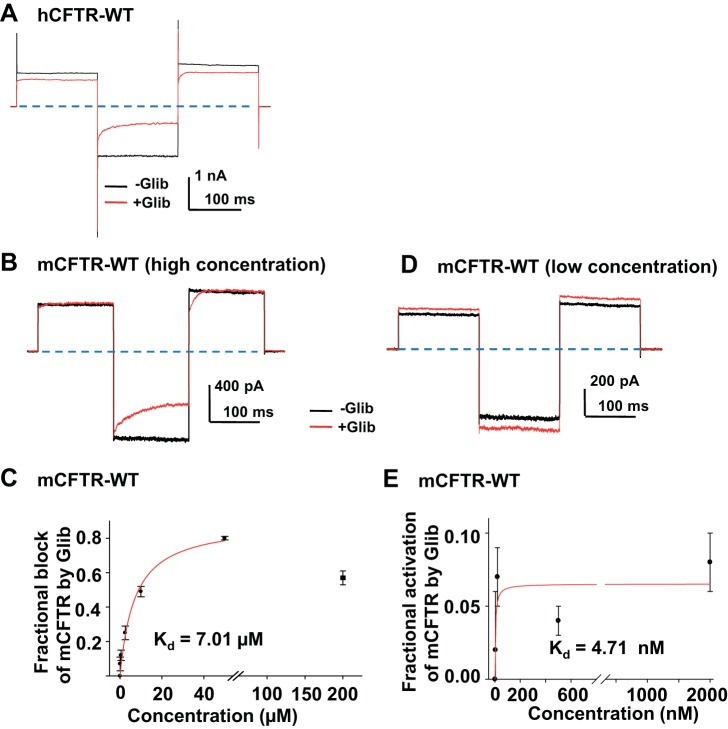
Fig. 10.
Glibenclamide (Glib) blocked as well as potentiated mCFTR. Representative macropatch current of hCFTR from 1 patch in the absence of glibenclamide (black) and in the presence of 50 μM glibenclamide (red) in 150 mM Cl− symmetrical solution. −Glib, 1 mM MgATP alone; + Glib, 50 μM glibenclamide + 1 mM MgATP. The voltage-step protocol is described in materials and methods and consisted of these phases: pulses to VM = +80 mV, −120 mV, and +100 mV. CFTR channels were previously phosphorylated with PKA and 1 mM MgATP. Dashed lines represent zero current level. Representative macroscopic current of mCFTR from the same patch in the absence and presence of glibenclamide (10 μM in B, and 20 nM in C), with the same recording conditions as A. D: concentration dependence of steady-state block by glibenclamide at VM = −120 mV. The apparent Kd = 7.01 μM for block was obtained from a fit with a 1-site, ligand-saturation-binding equation (red line, n = 4–6 patches for each concentration). E: concentration-dependent potentiation of mCFTR by glibenclamide at VM = +100 mV. Apparent Kd = 4.71 nM for potentiation was obtained from a fit by using the same equation (red line, n = 4–6 patches for each concentration).

