Fig. 8.
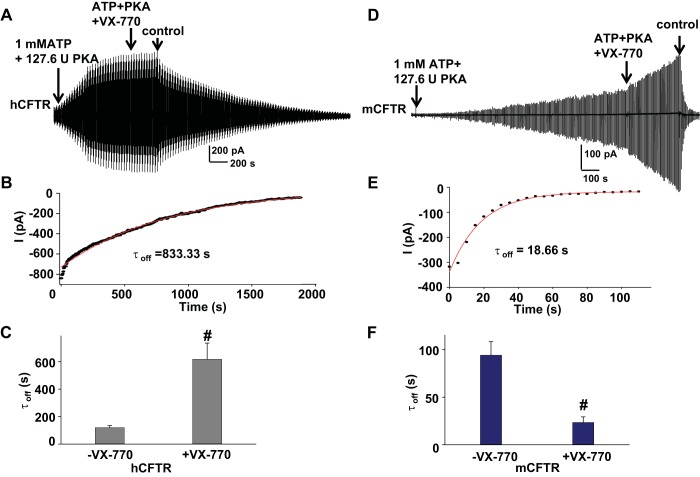
Rate of deactivation of current upon removal of PKA and ATP after exposure to VX-770 was increased for mCFTR but decreased for hCFTR. Representative current trace for hCFTR after exposure to 10 μM VX-770 (A) or mCFTR after exposure to 0.5 μM VX-770 (D), recorded under standard conditions. B and E show single exponential fits to the time courses of current deactivation at VM −100 mV for hCFTR (B) and mCFTR (E). Summary data for mean deactivation time constants in the absence and presence of VX-770 are shown in C and F. #P < 0.001 compared with no-VX-770-treatment conditions (−VX-770) (n = 4 each).

