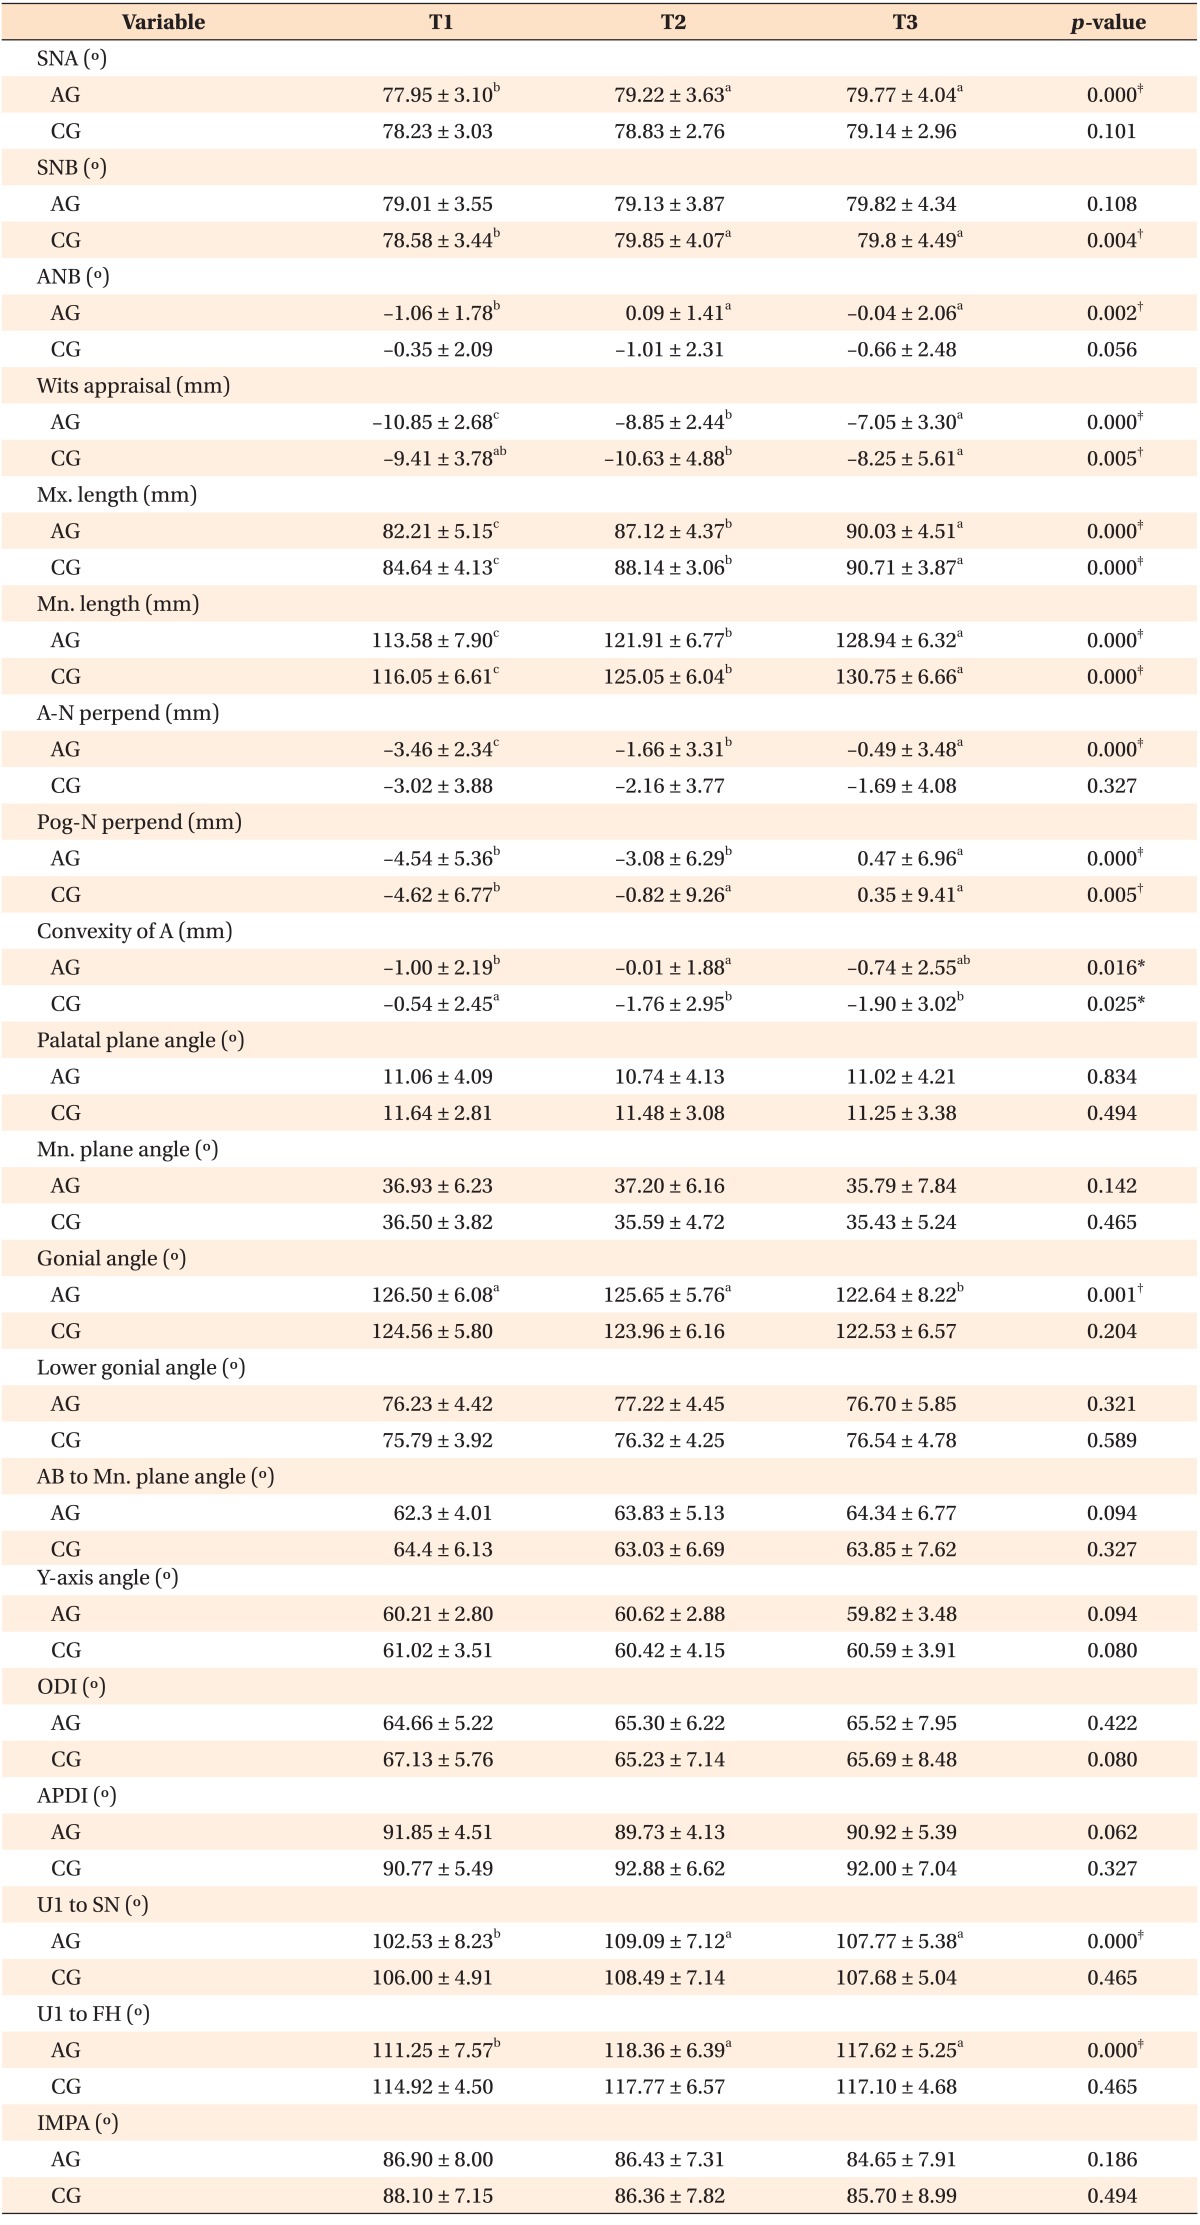
Table 4. Cephalometric measurements of Class III activator treatment group (AG) and Class III control group (CG).

Values are presented as mean ± standard deviation.
T1, Initial stage; T2, post-activator treatment or post-mandibular growth peak stage; T3, long-term follow-up stage.
Friedman test and Wilcoxon signed rank test (Bonferroni correction) for post-hoc comparisons were used. Means with different letters are significantly different according to the Wilcoxon signed rank test (Bonferroni correction): a>b>c.
*p<0.05; †p<0.01; ‡p<0.001.
Refer to Table 2 for the definition of each measurements.
