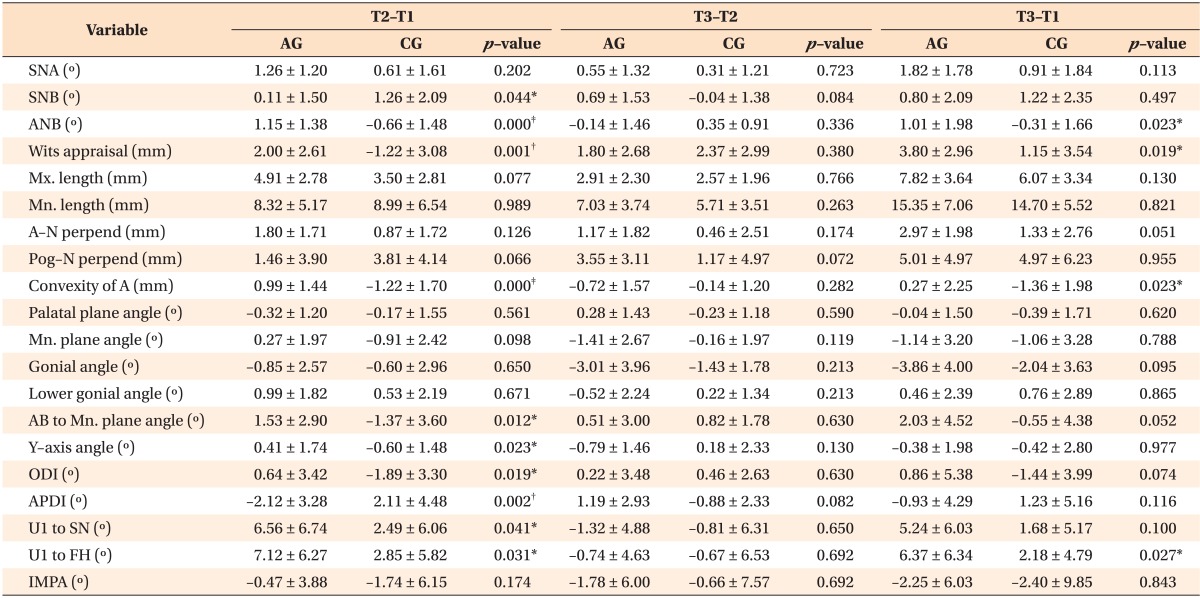
Table 5. Statistical comparison of cephalometric measurements changes between Class III activator treatment group (AG) and Class III control group (CG) during the periods.

Values are presented as mean ± standard deviation.
Mann-Whitney U-test was used.
T1, Initial stage; T2, post-activator treatment or post-mandibular growth peak stage; T3, long-term follow-up stage.
*p<0.05; †p<0.01; ‡p<0.001
Refer to Table 2 for the definition of each measurements.
