
Table 1. Comparison of mean labial alveolar bone thickness values at ten root levels by analysis of variance (ANOVA).
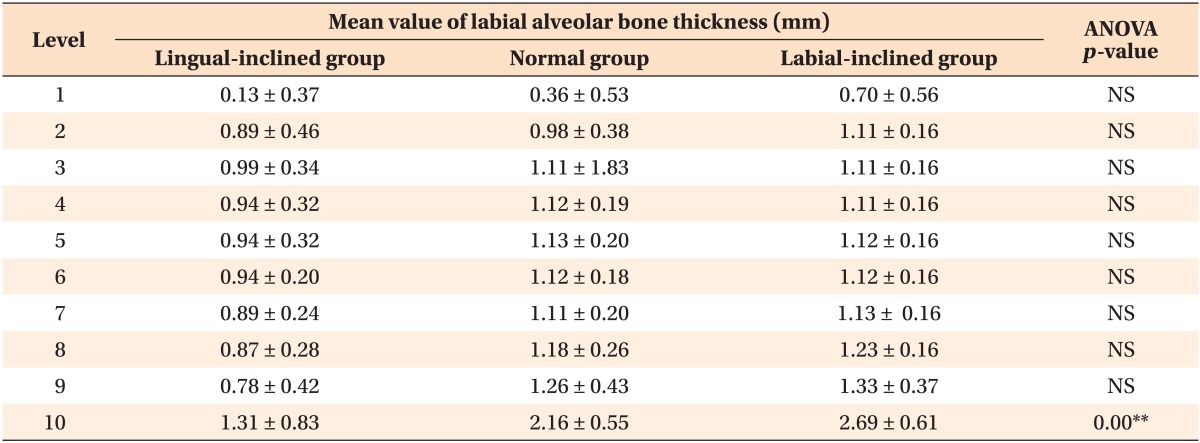
Values are presented as mean ± standard deviation.
**p < 0.01.
NS indicates no statistical significance among the three groups.
Official websites use .gov
A
.gov website belongs to an official
government organization in the United States.
Secure .gov websites use HTTPS
A lock (
) or https:// means you've safely
connected to the .gov website. Share sensitive
information only on official, secure websites.
Values are presented as mean ± standard deviation.
**p < 0.01.
NS indicates no statistical significance among the three groups.