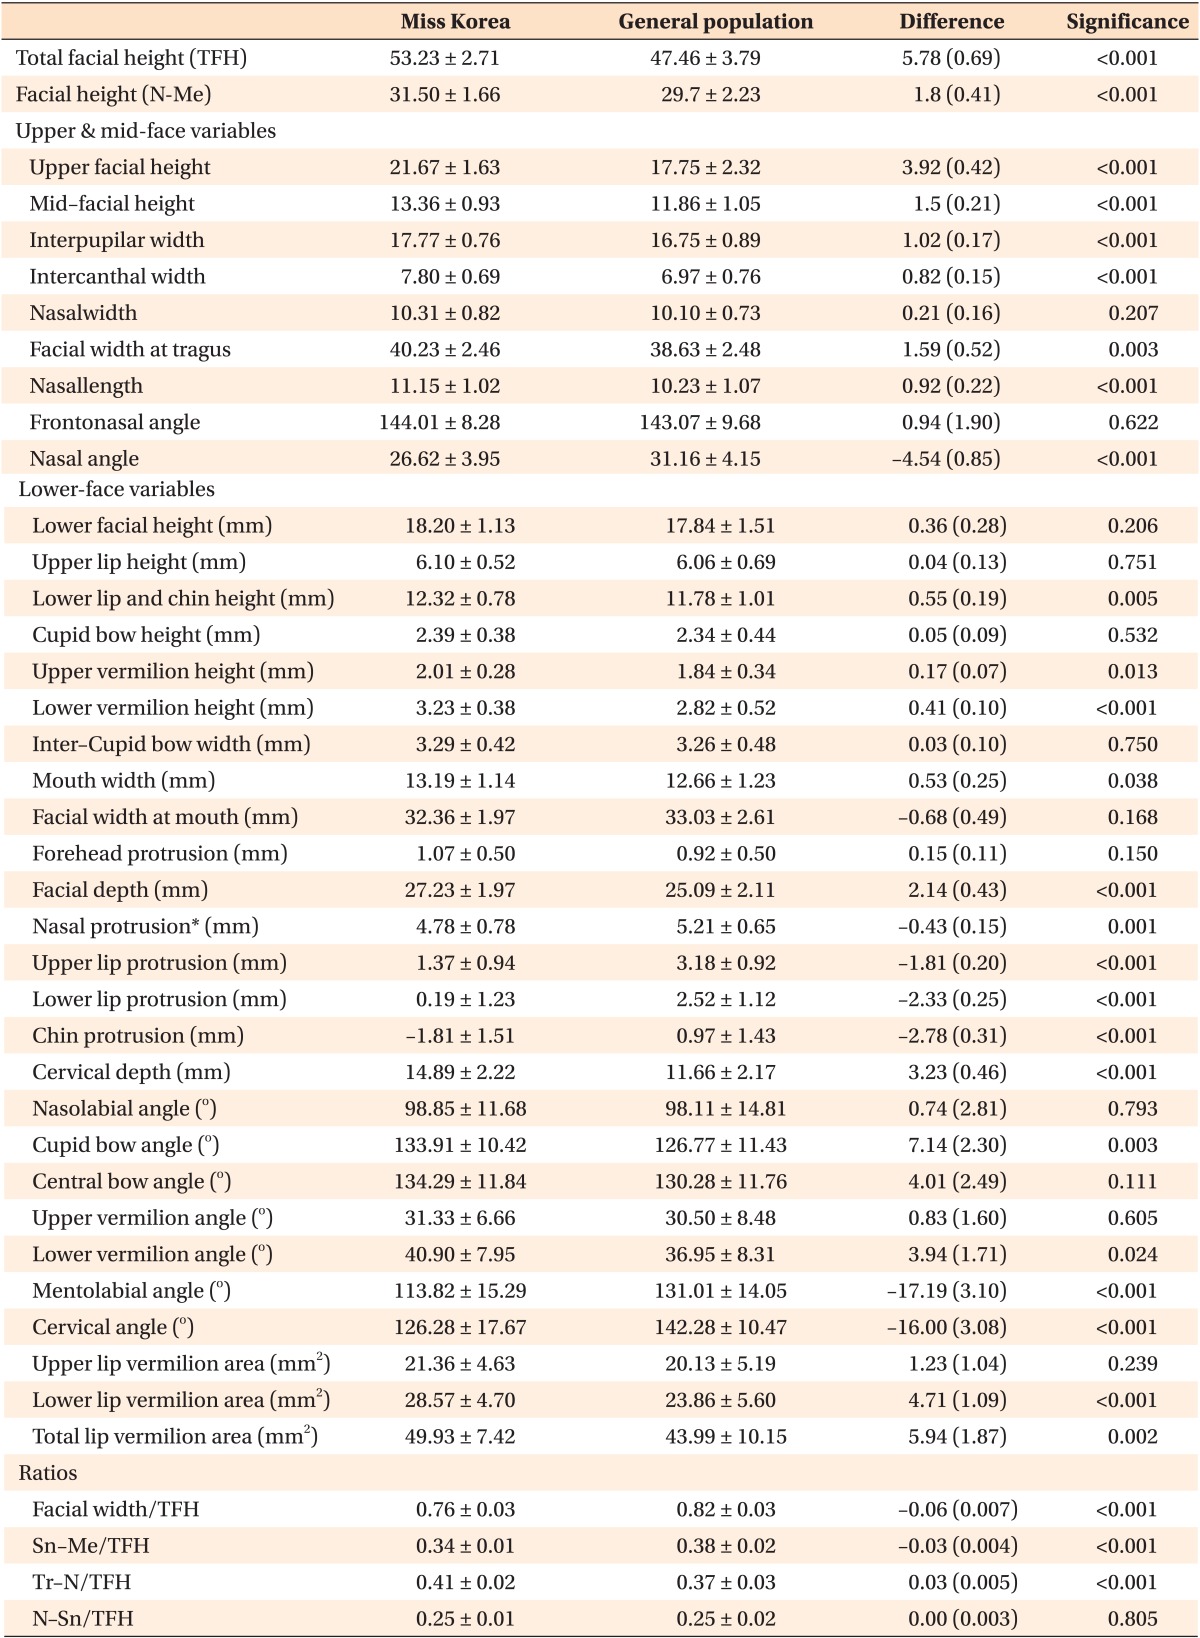
Table 3. Comparison of facial dimensions between the Miss Korea and control groups.

Values are presented as mean ± standard deviation or mean (standard error).
By multivariate analysis of variance (MANOVA).
*Mann-Whitney U test.

Values are presented as mean ± standard deviation or mean (standard error).
By multivariate analysis of variance (MANOVA).
*Mann-Whitney U test.