
FIG. 3.
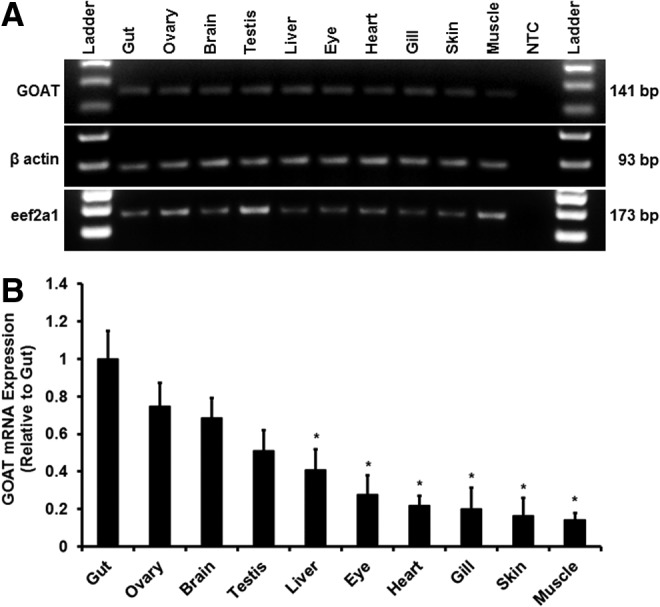
Tissue distribution of GOAT mRNA in zebrafish. (A) Agarose gel showing RT-qPCR amplicons for GOAT mRNA (expected amplicon size: 141 bp), β-actin (expected amplicon size: 93 bp), and eukaryotic elongation factor 2 alpha 1 (eef2a1) (expected amplicon size: 173 bp). Water in place of cDNA was run as a no-template negative control (NTC). Quantitative results for GOAT (B) mRNA expression in various tissues of zebrafish obtained using RT-qPCR. The results were normalized to β-actin, which served as a control to verify the quality and amount of samples. Results are expressed as relative expression levels to the tissue with the highest expression of GOAT. Error bars represent standard error of the mean. Asterisks (*) denote significant differences compared to gut (p<0.05, n=6 zebrafish).