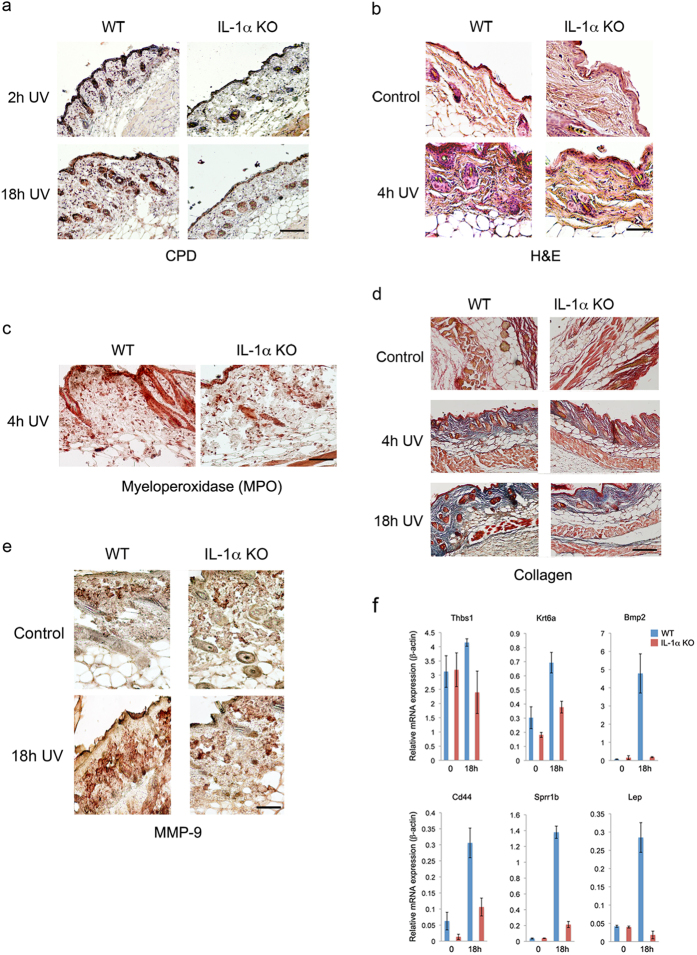
Figure 4. IL-1α is implicated in DNA damage associated skin inflammation, efficient wound healing and tissue repair.
(a) IL-1α deficiency does not have a detectable effect on UV-induced epidermal Cyclobutane Pyrimidine Dimers (CPD) staining. WT and IL-1α KO mice were exposed to UV and sacrificed at different time points (2 h, and 18 h, n = 5 for each time point). Skin samples were obtained and analyzed for CPDs using immunohistochemistry. Staining at 2 h after UV exposure was used as control. While no obvious differences could be observed in CPD removal after 18 h, remarkable skin swelling is observed in WT but not in IL-1α KO mice skin samples. (b) IL-1α deficiency results in impaired skin inflammation and leukocyte infiltration after UV exposure. Paraffin-embedded skin samples from non-exposed (control) or UV exposed (4 h UV) WT and IL-1α KO mice were subjected to Hematoxylin and Eosin (H & E) staining. Representative snapshots of micrographs of H & E staining are shown. (c) IL-1α is important for neutrophil recruitment to the damaged site. Immunohistochemical staining of myeloperoxidase (MPO) in skins of WT or IL-1α KO mice 4 h after UV exposure (4 h UV. (d) WT and IL-1α KO mice were exposed to UV and were sacrificed at different time points (Control-non-exposed skin, 2 h, 4 h and 18 h hours after UVB exposure). Skin samples were treated and processed as described in Materials and Methods and stained with Masson’s trichrome to visualize Collagen fibers (blue) (e) Reduced MMP-9 induction in IL-1α deficient skins in response to UV exposure. Immunohistochemical staining of MMP-9 in WT or IL-1α KO mice skins before (control) or 18 h (18 h UV) after UV exposure. For quantifications see Supplementary Figure 4. (f) IL-1α is required for correct expression of wound healing related genes after skin DNA damage. RNA was extracted from the formalin-fixed, paraffin-embedded (FFPE) skin tissue sections and qPCR for the indicated genes was performed to monitor gene expression after cDNA synthesis. Data is expressed as mean ± SD of three independent samples.

