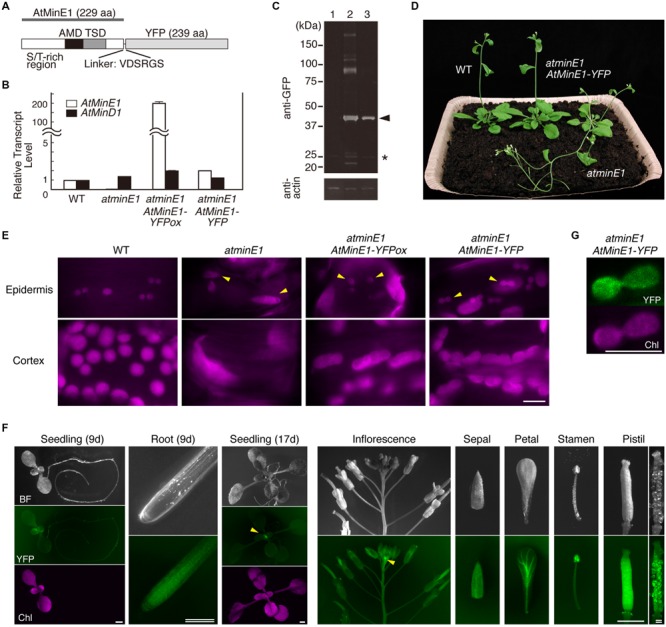
FIGURE 5.

Expression and function of AtMinE1-YFP in atminE1. (A) Domain structure of AtMinE1-YFP. Three regions of AtMinE1, an S/T-rich N-terminal region, an E. coli AMD (anti-MinCD domain)-like region, and an E. coli TSD (topological specificity domain)-like region, as well as a linker sequence between AtMinE1 and YFP, are indicated. (B) Quantitative RT-PCR analysis. RNAs from leaves of WT, atminE1, and transgenic atminE1 with AtMinE1p::AtMinE1-YFP (an overexpression line and a complemented line) were analyzed. Relative amounts of AtMinE1 (white bars) and AtMinD1 (black bars) transcripts compared to 18S rRNA (WT = 1) are shown. (C) Immunoblotting. Proteins from seedlings of WT (lane 1) and transgenic atminE1 plants (an overexpression line [lane 2] and a complemented line [lane 3]) were analyzed using mouse anti-GFP and anti-actin antibodies. Chemiluminescent signals of AtMinE1-YFP (arrowhead) and non-specific, extra signals (∗) are indicated at the right. (D) Complementation of plant phenotype of atminE1 by AtMinE1-YFP. One-month-old WT, atminE1, and a complemented plant are shown. (E) Complementation of plastid morphology of atminE1 by AtMinE1-YFP. Images of chlorophyll autofluorescence from epidermal (top; from 3-week-old seedlings) and cortex (bottom; from 2-week-old seedlings) plastids of WT, atminE1, and transgenic atminE1 plants are shown. Arrowheads represent epidermal plastids. Bar = 10 μm. (F) Fluorescence stereomicroscopy. A complemented atminE1 line at both the vegetative and reproductive stages was observed. Images of bright field (BF), YFP fluorescence (green), and chlorophyll autofluorescence (Chl, magenta) are shown. Arrowheads indicate accumulation of YFP signals at the shoot apices. Bars = 1 mm (single) and 200 μm (double). (G) Localization of AtMinE1-YFP signals in leaf epidermal plastids. Fluorescence images of YFP (green) and chlorophyll (magenta) in a leaf epidermal cell of the complemented atminE1 line are shown. Bar = 5 μm.
