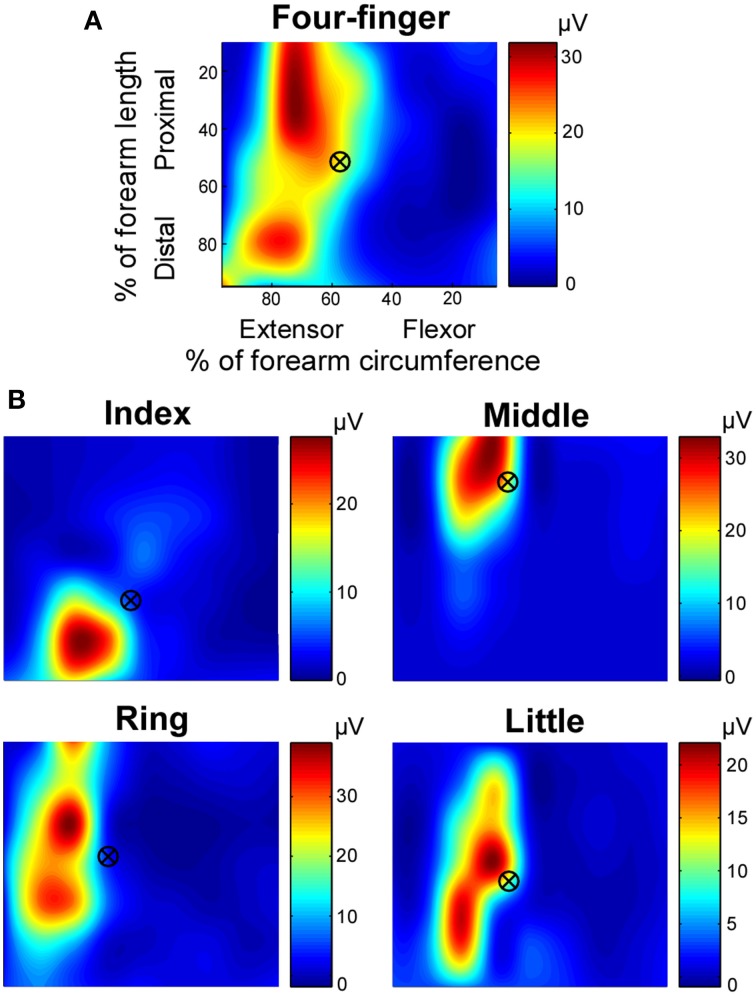
Figure 3.
Exemplar root mean square (RMS) map of individual finger and four-finger extensions. The RMS maps, based on monopolar EMG signals, were shown in relative dimensions. (A) RMS map in the four-finger extension task. (B) RMS maps in individual finger extension tasks. The centroid marks are also shown over the RMS map. Note that the color coding scales individually with each map.

