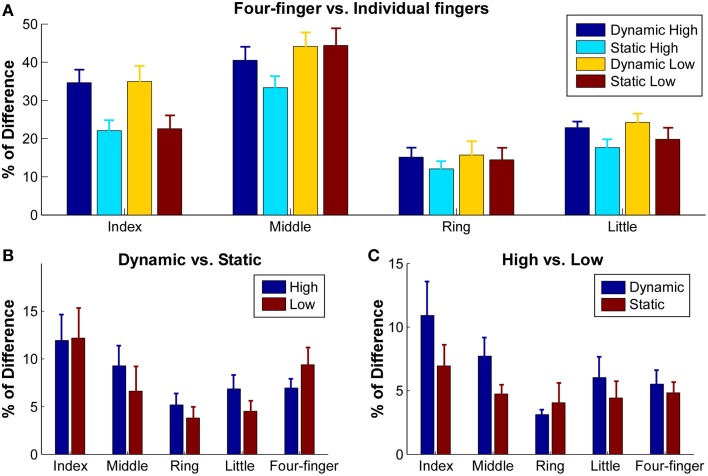
Figure 5.
Sum of squared difference (SSD) between normalized RMS maps of different tasks. RMS maps were normalized with respect to their own maximum values. (A) SSD between four-finger extension and individual finger extensions in different conditions. Error bars represent standard errors between subjects. (B) SSD between dynamic and static extensions in high and low conditions. (C) SSD between high and low extensions in dynamic and static conditions.

