
Figure 4. Z’ factor analysis.
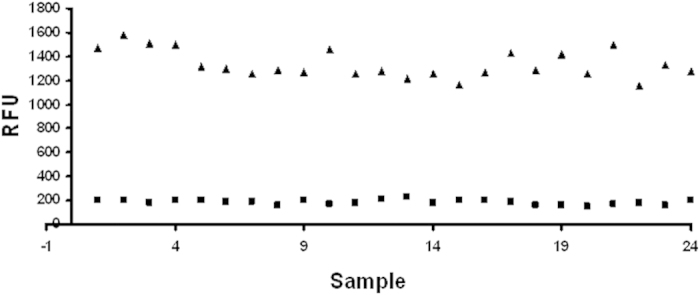
The scatter plot showing the positive control (triangle shaped) and negative control (square shaped) data for the Z’ factor calculation. 24 samples were used for computing the means and standard deviations. The experiment was performed in triplicate.