
Figure 5. The effect of pH and NaCl concentration on the enzymatic activity was observed.
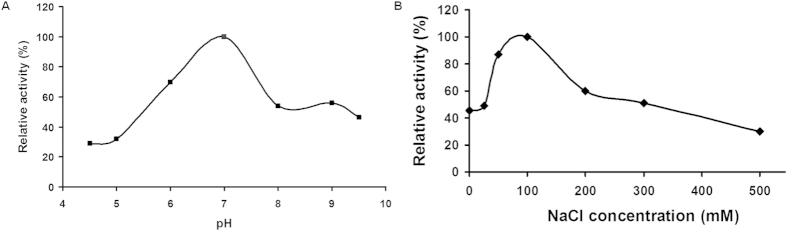
(A) Using the buffers of pH ranging from 4.5 to 9.5, the pH optimum was calculated for the proteolytic activity. The relative activity was calculated at different pHs by taking the activity at pH 7.0 as 100%. (B) The activity at NaCl concentration of 100 mM was taken as 100% and the relative activity for other NaCl concentrations was calculated. All the readings are the average of the triplicate data and the values are normalized by using readings obtained from the reaction containing no enzyme.