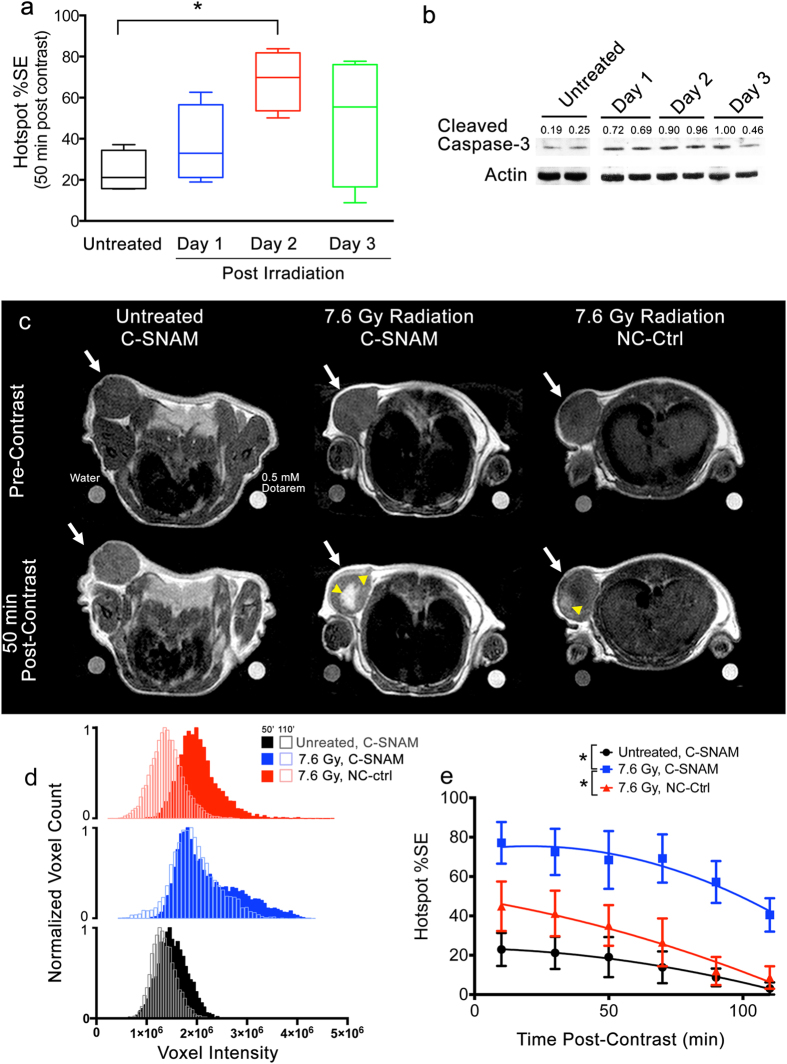
Figure 4. Imaging the therapeutic response to single dose radiation therapy in HeLa tumor-bearing mice.
(a) Box plot showing hotspot %SE due to caspase-3 activation for untreated mice (black), or for mice receiving 7.6 Gy tumor irradiation and imaged 1 (blue), 2 (red), or 3 days (green) later. All imaging was performed with C-SNAM. *p < 0.05 (ANOVA), n = 4 mice per group. (b) Western blot following cleaved caspase-3 expression in untreated mice and over time after tumor irradiation. Values are cleaved caspase-3 band intensities normalized to actin loading control. (c) Representative MR images of untreated (left) and treated mice (center) receiving C-SNAM, and treated mice receiving NC-ctrl (right) pre-contrast (top) and 50 min post-contrast (bottom). Tumor is indicated by white arrow, and hot spots are indicated by yellow arrowhead. Water and 0.5 mM Dotarem phantoms are shown on bottom left and right, respectively, of each image. (d) Representative voxel histograms for untreated (black) and treated (blue) mice receiving C-SNAM, and treated mice receiving NC-ctrl (red). Histograms are shown 50 min post-contrast (solid bars) and 110 min post-contrast (open bars). (e) The percent signal enhancement (%SE) for hotspot signal enhancement (mean signal within the top quartile of the enhancement histogram) is plotted over time for untreated (black) and treated (blue) mice receiving C-SNAM, and treated mice receiving NC-ctrl (red). Values are mean ± s.d., *p < 0.05 (general linear model repeated measures), and n = 4 per group.

