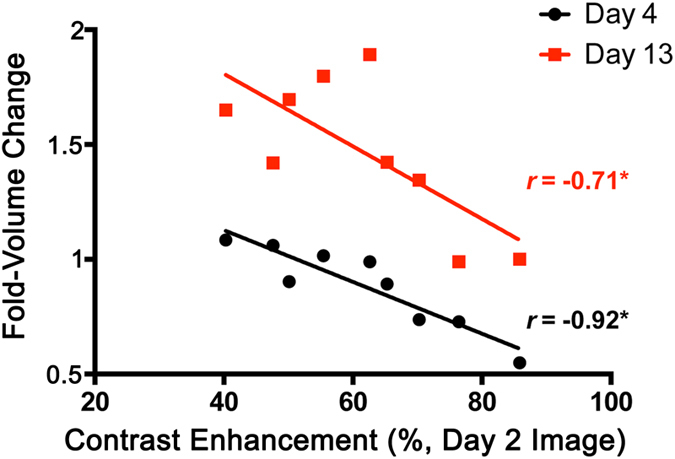
Figure 5. Interrogation of the relationship of C-SNAM MR signal enhancement with tumor volume change following radiation therapy.

Tumor size change was measured as the fold-change in volume 4 days (black circles) or 13 days (red square) following the day of treatment administration (Fold-Volume Change). MR signal enhancement with C-SNAM was measured 2 days following tumor irradiation and was quantified as the hotspot %SE. Pearson’s correlation coefficients (r) are shown for day 4 and day 13 following treatment of the same group of animals. *p < 0.05 (Pearson’s r), n = 9.
