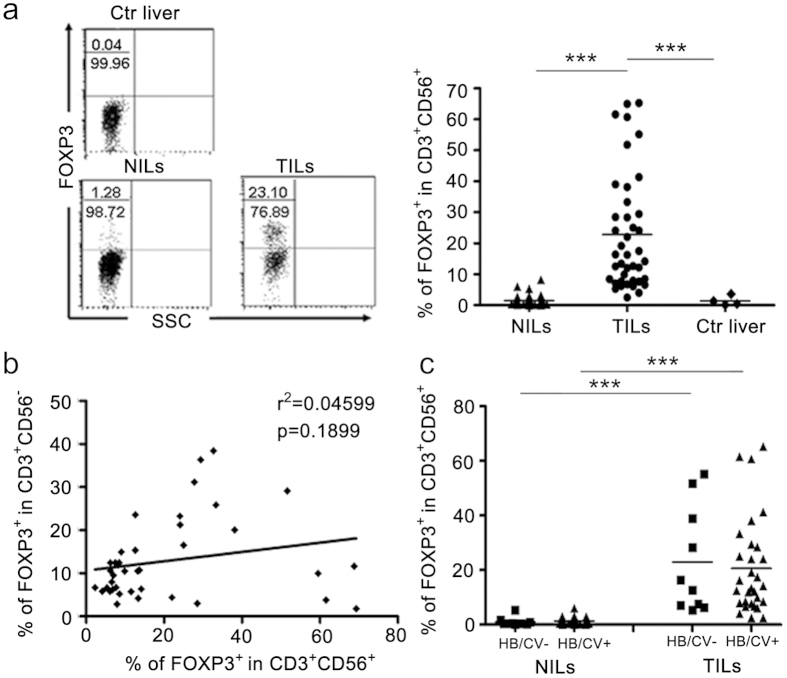
Figure 2. The presence of FOXP3+CD3+CD56+ cells in HCC tumor tissues.
FOXP3 expression was determined by flow cytometry in CD3+CD56+ cells from control liver tissues (n = 4), tumorous (n = 41) and non-tumorous (n = 37) tissues of HCC patients. (a) A representative FACS profile is shown on the left and the percentage of FOXP3+ cells in CD3+CD56+ cells from individual patients are summarized in the right. The numbers denote the percentage of the cell population in the left two quadrants. (b) A correlation analysis was performed between the percentage of FOXP3+ cells in the CD3+CD56+ cell population and that in CD3+CD56– conventional T cell population in the TILs from 41 HCC patients. (c) FOXP3 expression in CD3+CD56+ cells in TILs and NILs were compared between HCC patients with or without a history of HBV/HCV infection.

