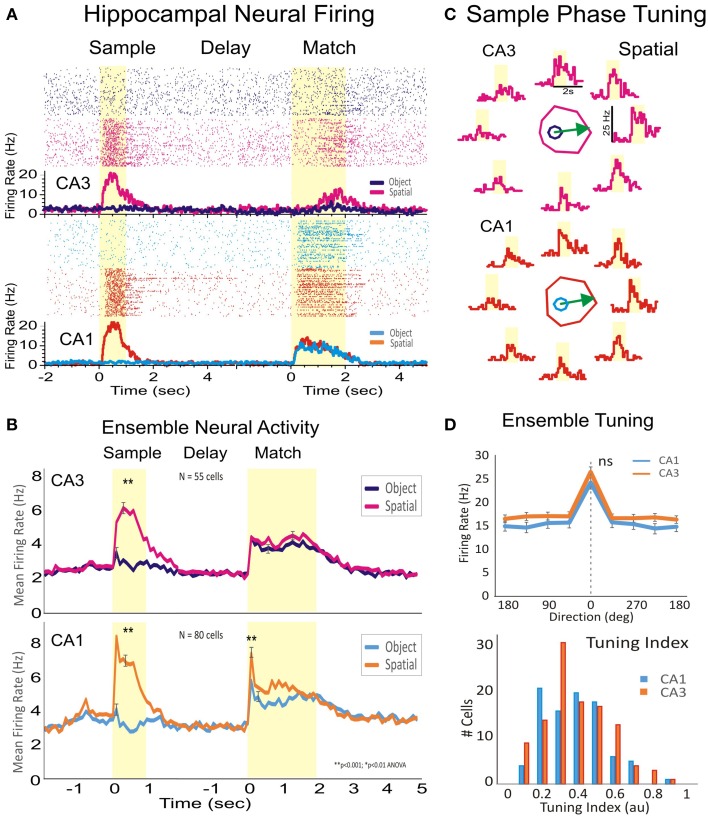
Figure 2.
Encoding of the spatial location of target images by hippocampal subfields CA1-CA3. (A) Rasters and peri-event histogram depicting the firing of two hippocampal cells from CA1 and CA3 in response to the presentation of the sample, trial delay and presentation of the match phase. Both cells respond to sample target location when the spatial rule is in effect, but did not increase firing on object trials. (B) Firing for the subpopulation of hippocampal cells recorded from CA1 (n = 80) and from CA3 (n = 55) in four animals. While during sample presentation cells fired only during spatial trials and not to object trials, during the match phase the cells fired to both spatial and object cued stimuli. (C) Individual tuning plots for the two cells in (A) showing firing preference during sample presentation to the spatial location of the image on the right side of the screen. (D) Population tuning and tuning index of cells in CA3 and CA1 firing to a given spatial position of the Sample image. Error bars represent SEMs. Asterisks: **p < 0.001, ANOVA. “ns” represents a nonsignificant statistic.

