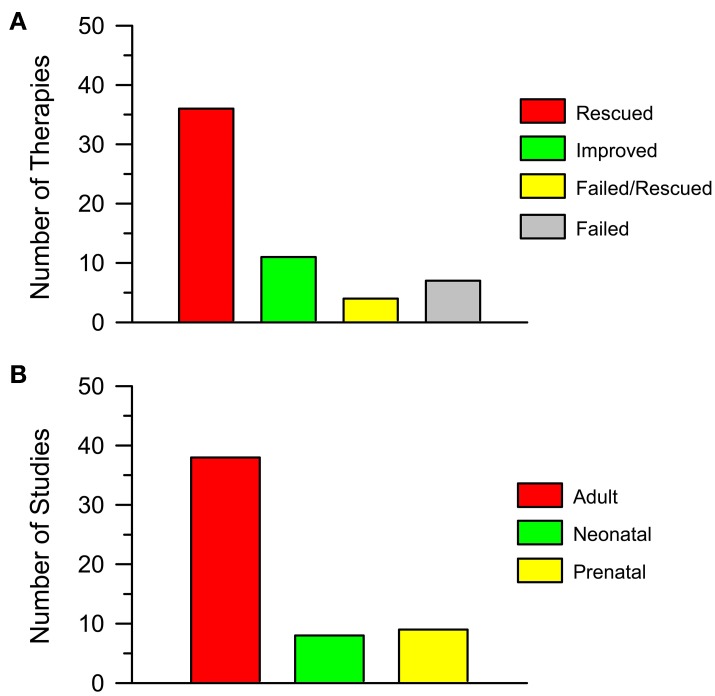
Figure 3.
Pharmacotherapies in the Ts65Dn mouse model of Down syndrome. (A) The histogram shows the number of attempted pharmacotherapies in the Ts65Dn mouse model of DS that rescued (Rescued), improved (Improved), partially rescued (Failed/Rescued) the examined phenotype/s or had no effect (Failed). Data derive from Tables 1, 2. (B) The histogram shows the number of studies in which pharmacotherapies were administered at adult life stages, in the neonatal period and in the prenatal (in some instances plus post-natal) period. Data derive from Tables 1, 2.

