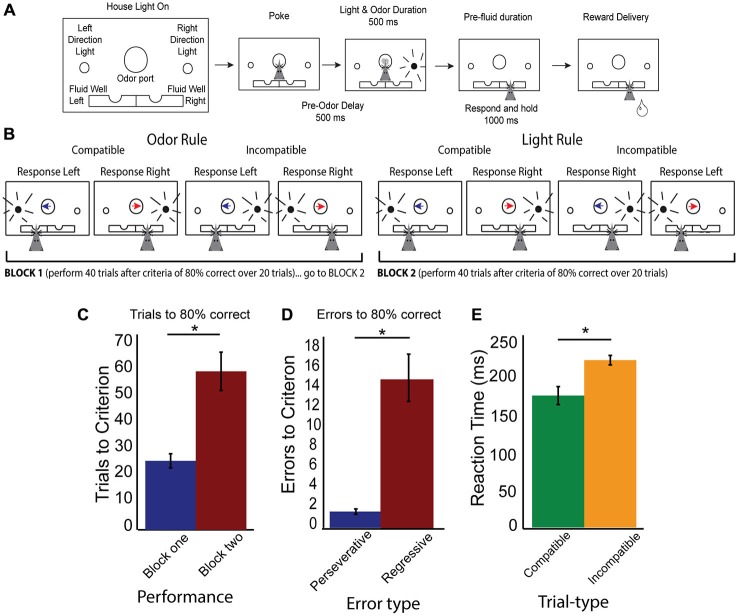
Figure 1.
Rule shifting behavior schematic and measures. (A) Schematic of odor port, fluid wells and simultaneous directional cues as well as flow chart of successful trial completion denoting specific time delays. (B) Example correct responses within different rule blocks, demonstrating compatible and incompatible trials with simultaneous directional information presented by both cues. Blue arrow indicates the “left” direction odor, Red arrow indicates the “right” direction odor, while black radiating circle represents the side of the light. Rat head represents the correct choice made by a rat which would have previously received the simultaneous presentation of both odor and light cues before making his choice. (C) Data showing increased number of trials required to reach criterion after a switched rule, with trials to criterion in block one (blue bar) and block two (red bar). (D) Data demonstrating a significant number of errors are regressive (red bar), rather than perseverative (blue bar). (E) Reaction time data (cue offset to port exit), demonstrating significant slowing on incompatible (orange bars) compared to compatible trial-types (green bars). Significance of at least p < 0.05 denoted with asterisk *.

