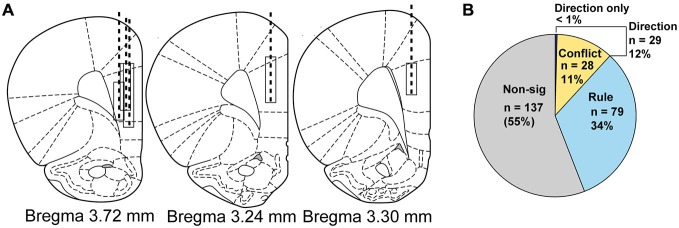
Figure 2.

Electrode implant beginning and final positions, drive paths and classification of neural activity by regression. (A) Atlas schematics showing electrode wire bundle implant locations (top of box) and location at completion of study (bottom of box) and general drive path (dashed line) for five rats. (B) Pie chart showing by number and percentage the breakdown of neural activity types from regression analysis on neural firing, with non-modulated neuron data shown in gray, rule neurons in light blue, conflict neurons in yellow and direction neurons in purple.
