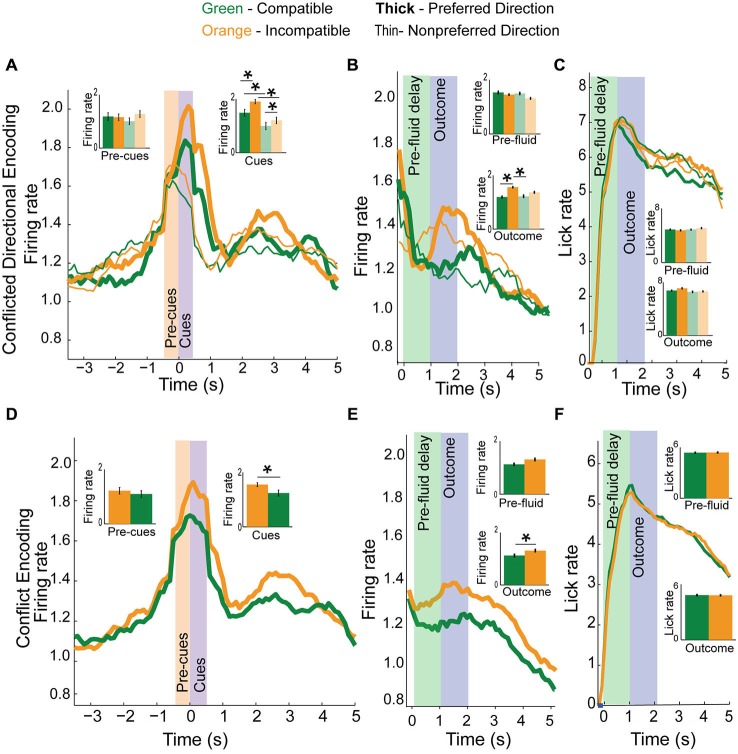
Figure 6.
Conflict and direction activity in the mPFC. (A) Top panel plots direction neurons based on preferred direction (thick) and non-preferred direction (thin) and by trial-type, compatible (green) and incompatible (orange) with inset bar graphs showing data during both pre-cue and cue epochs for correct and error (faded green and yellow) trials. While direction neurons were more active for one direction over another, activity in these neurons was more active when directional cues were in conflict than when they were compatible with each other. (B) Direction and conflict data demonstrates elevated activity for preferred direction incompatible trials during the outcome epoch, but not pre-fluid epoch. (C) Plots licking data demonstrating no difference in lick rate between trial-types. (D) Collapsing the data from (A) into compatible or incompatible trials, we see that directional neurons fire more for incompatible trial-types than for compatible trial-types when presented with cue information. (E) Activity plotted by compatibility averaged across direction during the pre-fluid and outcome epochs demonstrates a significant elevation of activity on correct incompatible trial-types compared to compatible trial-types but not during the pre-fluid epoch. (F) Plots licking rate by compatibility, and demonstrates no difference in lick rate between compatible or incompatible trial-types in either the pre-fluid or outcome epochs. Significance denoted of at least p < 0.05 with asterisk *.

