FIGURE 3.

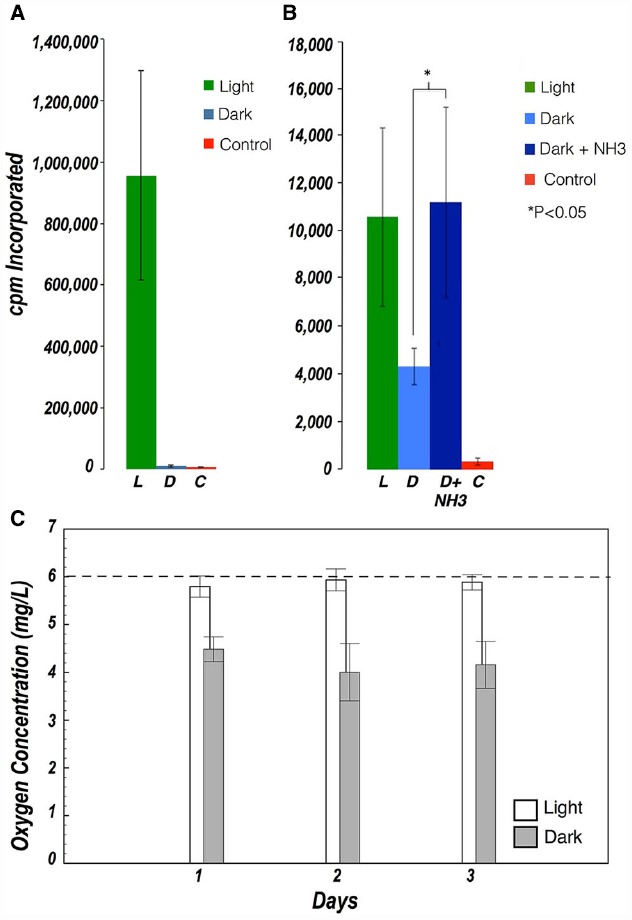
(A) Carbon fixation in halite cell suspensions in the presence of light (green) and in the dark (blue) (B) Carbon fixation in ground halite in the presence of light (green), in the dark (light blue), and in the dark after addition of NH3 as an electron donor (dark blue). Controls with no viable cells are shown in red. Dark Carbon uptake was only observed in ground samples (not in cell suspensions) and was stimulated after addition of NH3. Values represent the average of 3–5 measurements. Error bars represent standard deviations. (C) Evolution of oxygen concentration in cell suspensions exposed to light (white) and dark (gray). The dashed line shows the oxygen concentration measured at the beginning of the experiment.
