An official website of the United States government
Here's how you know
Official websites use .gov
A
.gov website belongs to an official
government organization in the United States.
Secure .gov websites use HTTPS
A lock (
) or https:// means you've safely
connected to the .gov website. Share sensitive
information only on official, secure websites.

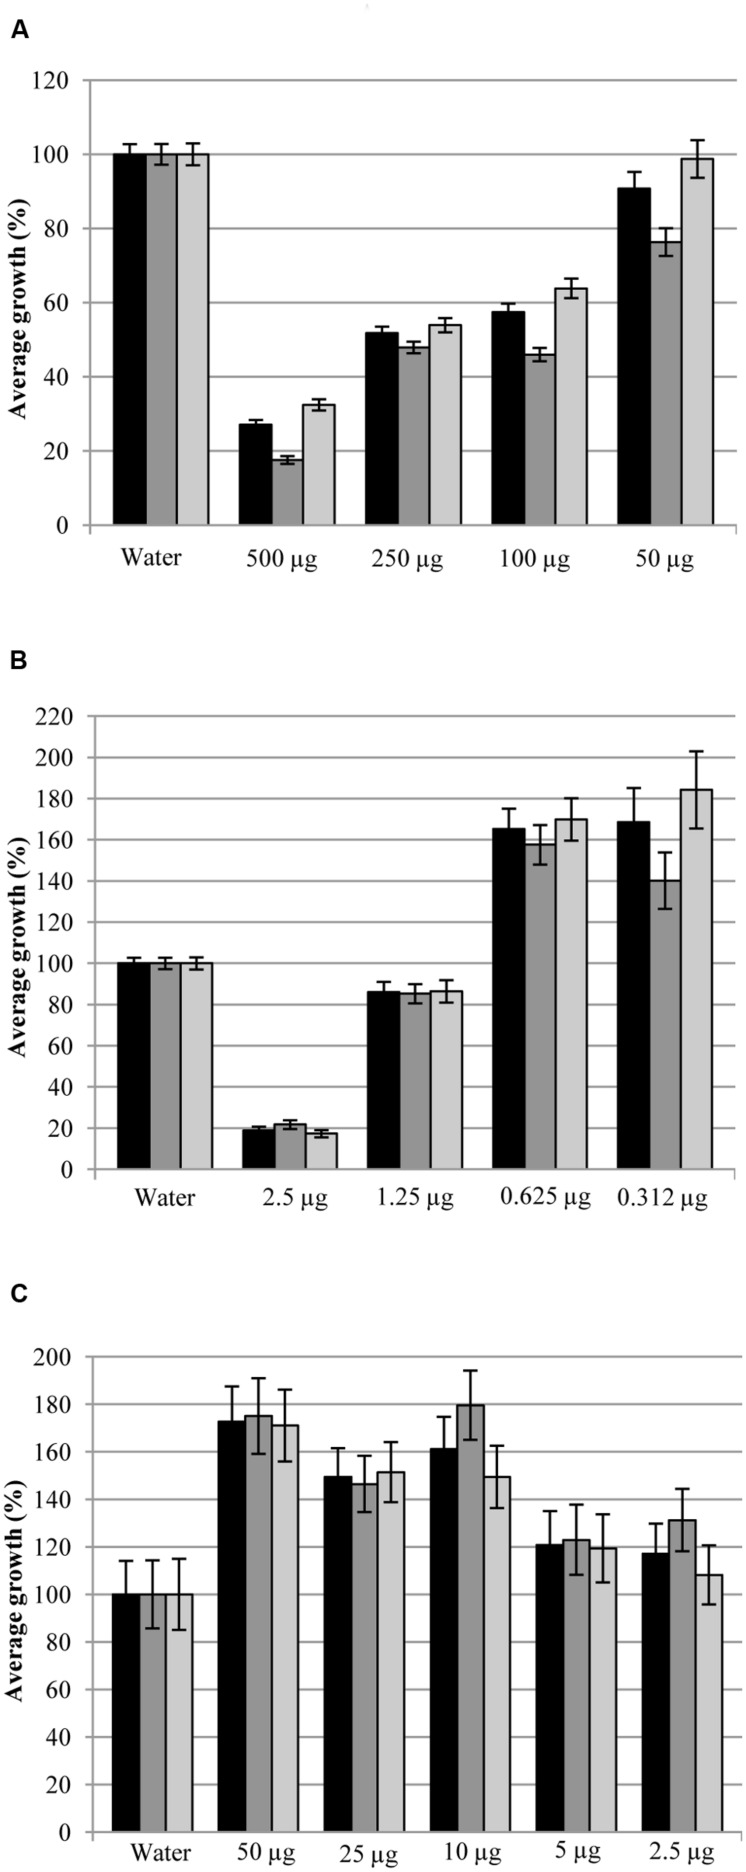
 ), epicotyls (
 ), and main rootlets (
 ) of broccoli in presence of pure MT (A), DMDS (B), and 1-undecene (C) aliquots. Bars on the columns correspond to the standard error of the mean in percentage.