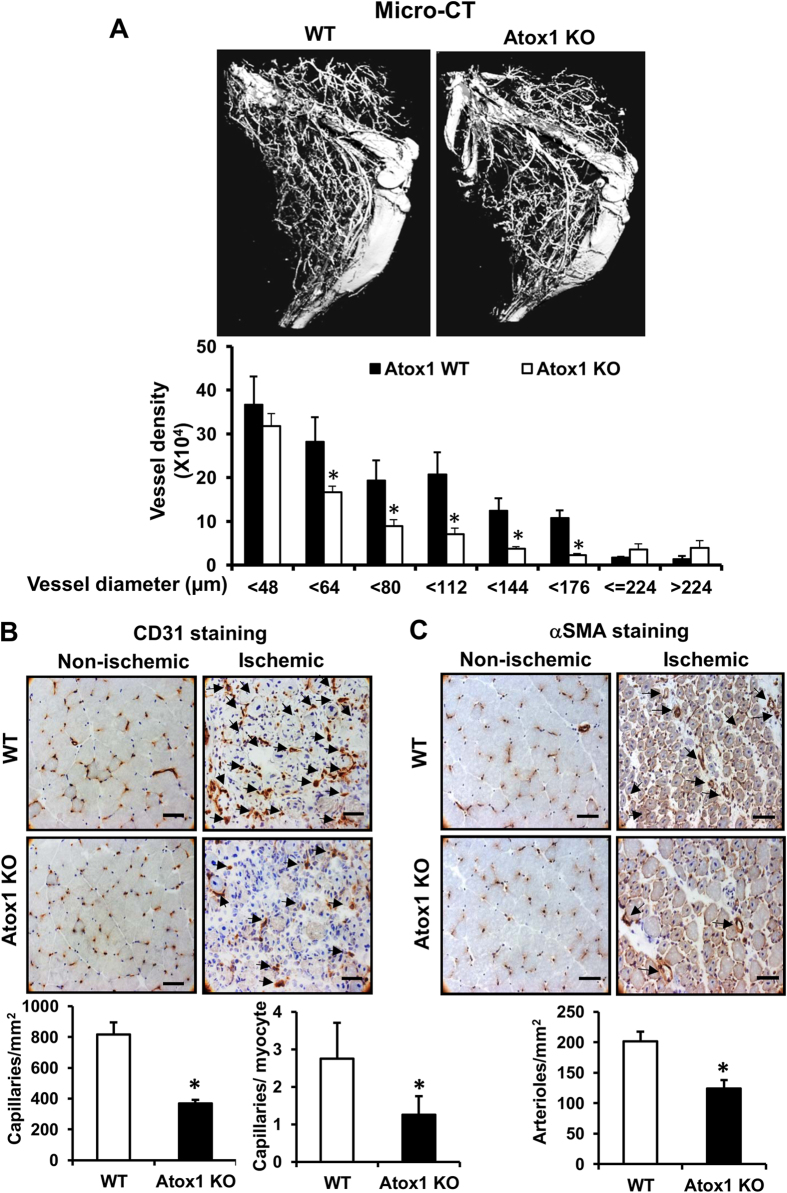
Figure 2. Atox1 is required for ischemia-induced arteriogenesis and angiogenesis.
(A) Representative micro-computed tomography (micro-CT) angiograms (16 μm resolution; arteriogenesis) of ischemic legs in WT and Atox1 KO mice at day 7 post-surgery. Bottom panel shows quantitative analysis of micro-CT, as the total number of vascular structures in 1355 z-axis slices over the ranges of sizes from 4 different mice. (B,C) Representative images of CD31 (EC marker)(B) and αSMA (arteriole)(C) staining in ischemic and non-ischemic gastrocnemius muscles of WT and Atox1 KO mice at day 7. Scale bars = 50 μm. Bottom panels show their quantitative analysis (n = 4). *p < 0.05.

