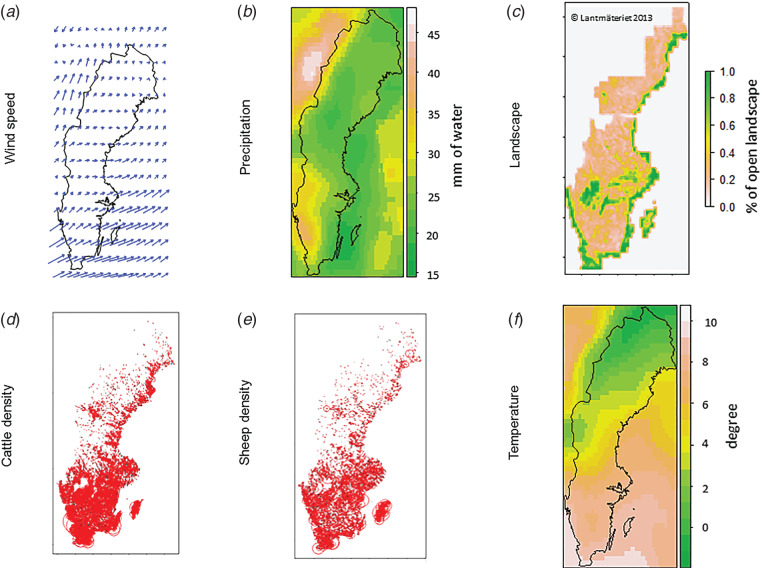
Fig. 1.
Spatial description of the climatic and environmental variables considered as possible risk factors for Coxiella burnetii infection. (a) Wind-related data is an average of data from the year before the ELISA test (Q1 = 1·04, median = 1·42, Q3 = 1·70). The angles of the arrows correspond to the wind direction and the lengths of arrows to the wind speed (m/s). The spatial resolution chosen for this figure (1° x 1° latitude and longitude) does not correspond to the resolution used for the analysis (0·25° x 0·25°). (b) Total cumulative precipitation in millimetres of water, for the year before the ELISA test (Q1 = 22·0, median = 25·1, Q3 = 29·2). (c) Percentage of open landscape calculated over a 5 km x 5 km area (Q1 = 0·28, median = 0·38, Q3 = 0·59). (d) Cattle density calculated within a 5 km radius around each herd included in the study (n = 1537) considering both dairy and beef cattle (Q1 = 3·8, median = 7·3, Q3 = 13·0). The length of the radius is proportional to the animal density. (e) Sheep density calculated within a 5 km radius around each herd included in the study (n = 1537) (Q1 = 1·1, median = 2·4, Q3 = 4·3) The length of the radius is proportional to the animal density. (f) Average temperature calculated the year before the ELISA test (Q1 = 6·8, median = 7·7, Q3 = 8·3); Sweden, November 2007–May 2009.

