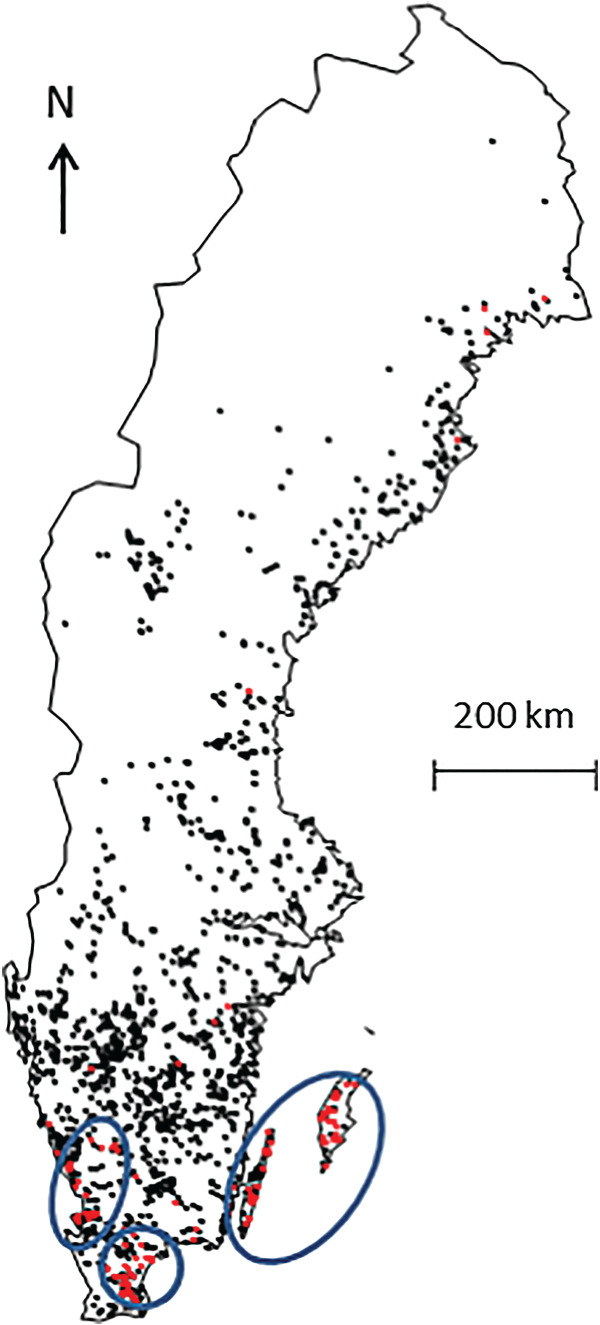
Fig. 3.

Location of the dairy herds included in the study (n = 1537). The red (n = 126) and black (n = 1411) dots represent herds that were positive and negative to ELISA against Coxiella burnetii (Cb) in the bulk tank milk, respectively. The blue circles correspond to areas with a higher risk of being detected ELISA positive. Sweden, October 2008–June 2009.
