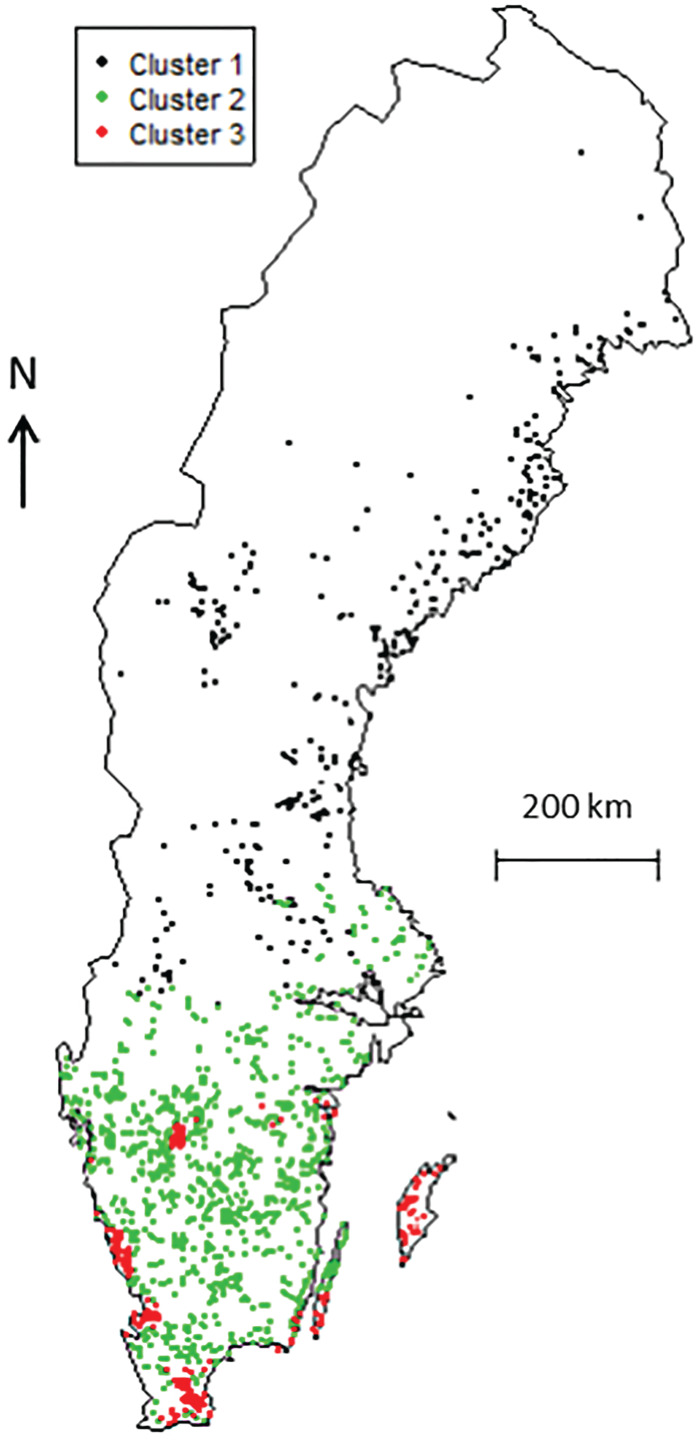
Fig. 4.

Locations of dairy herds (n = 1537) according to the cluster variable. The three clusters resulted from a hierarchical clustering that was performed on the principal component analysis using the following variables: wind speed, percentage of open landscape, animal densities (cattle and sheep) and temperature; Sweden, October 2008–June 2009.
