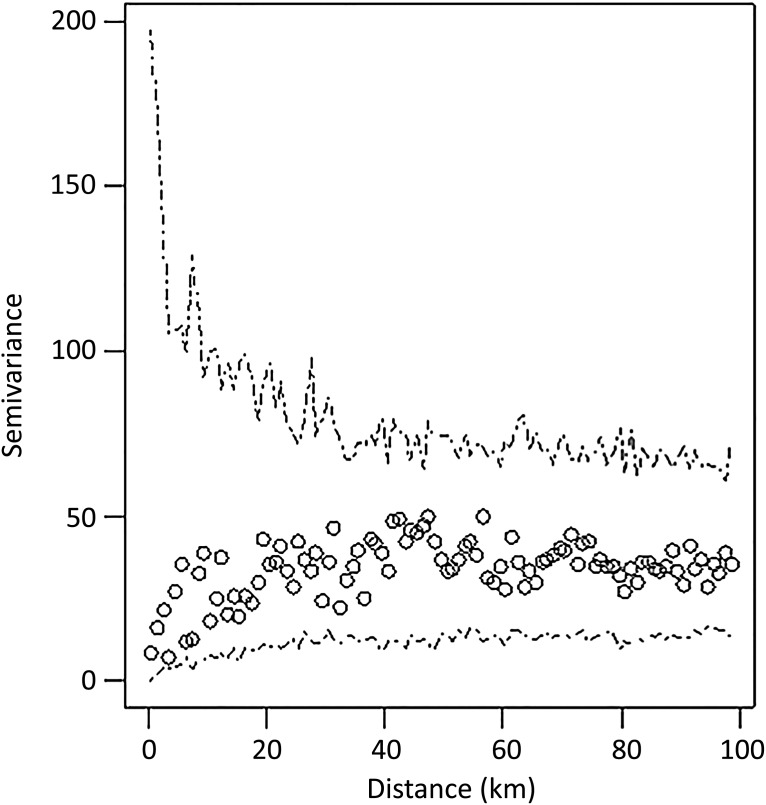
Fig. 5.
Variogram quantifying the semivariance between pairs of observations (herd residuals from the logistic regression model) as the function of their Euclidean distance. The envelopes were based on 999 Monte Carlo permutations of the data, whereby positive and negative herds were randomly allocated to each farm location. In all, 1537 Swedish dairy herds tested in 2008–2009 were included in this study on risk factors for Coxiella burnetii infection.

