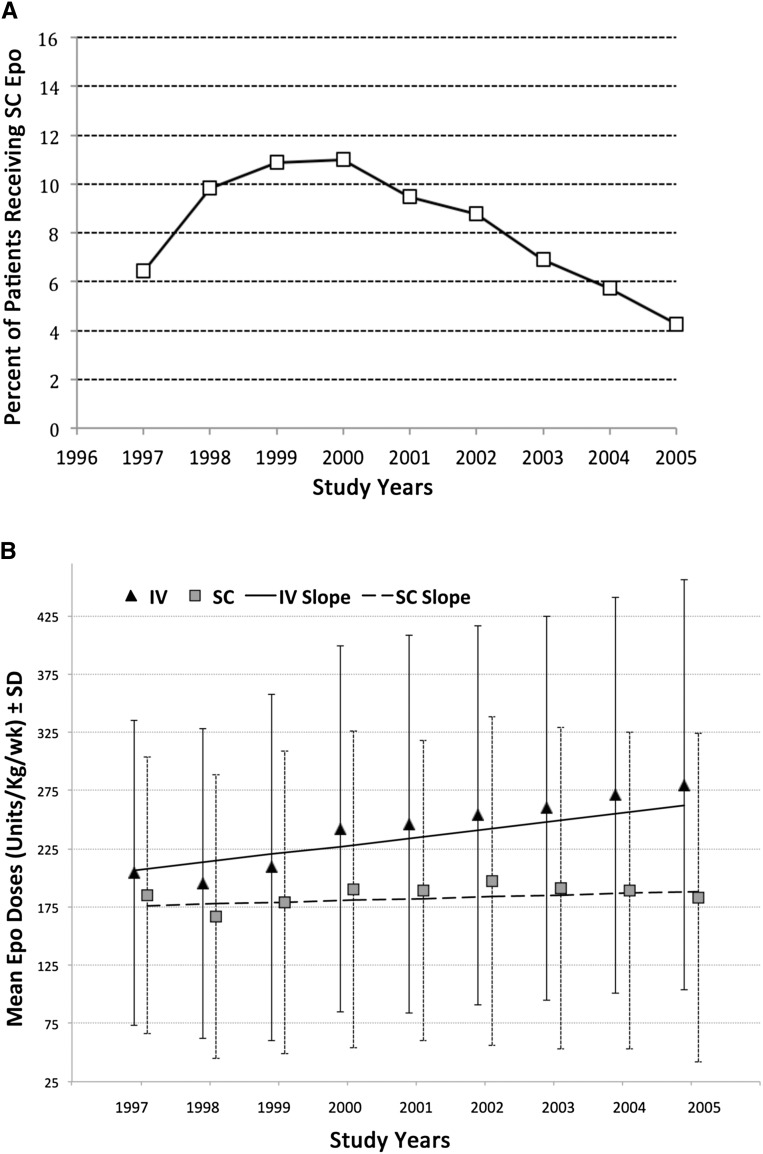
Figure 1.
Route of epoetin (Epo) administration and Epo dosing changed from 1997 to 2005. (A) Percentage of patients on hemodialysis managed with subcutaneous (SC) versus intravenous (IV) Epo from study year 1997 to 2005. (B) Mean doses of Epo (±SD) used to manage study subjects from study year 1997 to 2005. Slopes calculated by linear regression indicate that the mean doses of IV epoetin increased by 7.0 units/kg per week per year (P<0.001), whereas mean doses of SC epoetin increased by 1.5 units/kg per week per year (P=0.06).

