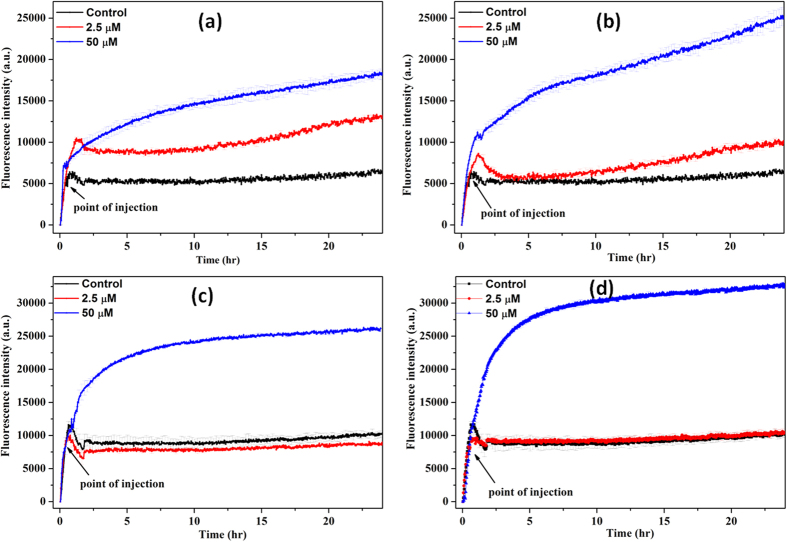
Figure 5. n-IONP and p-IONP induced ROS production.
Figure 5(a,c) represent change in fluorescence intensity with DCFH-DA oxidation in presence of n-IONP for B. subtilis and E. coli, respectively. Whereas figure 5(b,d) represent DCFH-DA oxidation kinetics in presence of p-IONP for B. subtilis and E. coli, respectively. Each curve represents the average of three independent measurements with corresponding standard error of mean.

