
Figure 3. Dynamics involving bacteria, phage, and mammalian immunity in vivo.
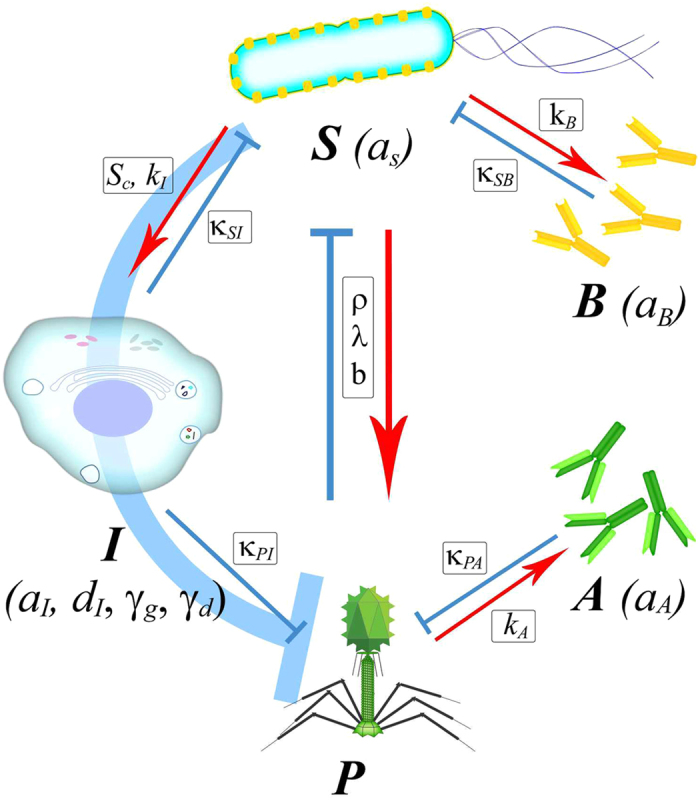
All symbols used in this schema have been applied as variables or parameters in equations of a mathematical model developed for studies of these interactions (see: Materials and Methods) P – bacteriophages, S – bacteria, I – innate immunity, A – adaptive immunity to phages, B – adaptive immunity to bacteria. Red arrows represent a stimulatory while blue arrows represent an inhibitory effect.