. 2015 Oct 5;44(20):7342–7370. doi: 10.1039/c5cs00376h

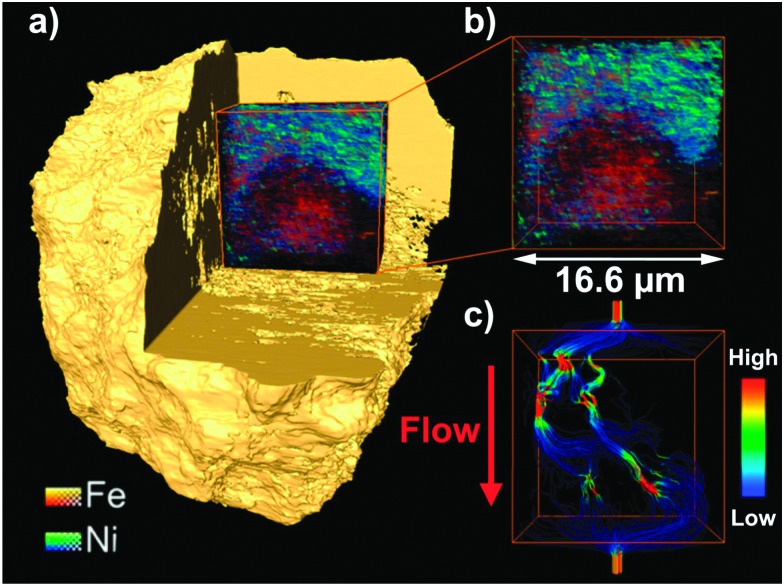
Fig. 23. X-ray nanotomography study of an E-cat catalyst particle, revealing the relative spatial distributions of Ni and Fe and their effect on the macropore structure and accessibility. A sub-volume of 16.6 × 16.6 × 10 μm3 was selected (b) out of the entire catalyst particle of 44.8 × 52.7 × 51.2 μm3 in size (a), including the relative Fe and Ni distributions. Permeability calculation was applied on this sub-volume (c). Mass transport through the sub-volume along the selected axis (red arrow) is visualized using the velocity field of the fluid. The streamlines indicate the magnitude of the velocity field where red represents the highest velocity (i.e., where the pore space constriction is the largest) and blue indicates the lowest velocity. (Reproduced with permission from ref. 170, Copyright American Chemical Society, 2015).

Fig. 23