. 2015 Oct 5;44(20):7342–7370. doi: 10.1039/c5cs00376h

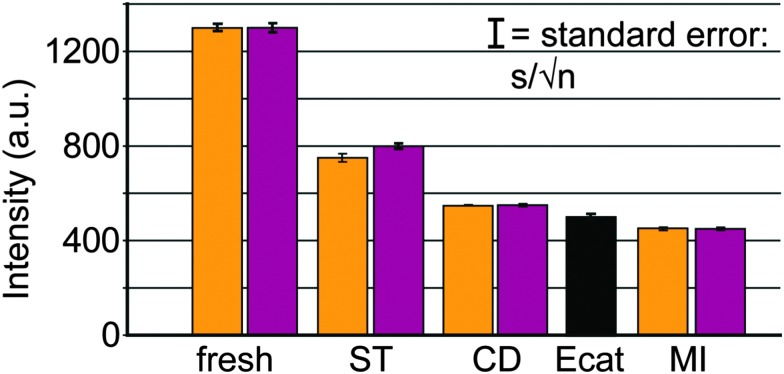
Fig. 28. Statistical analysis of the confocal fluorescence microscopy data obtained after thiophene selective staining for two different batches of FCC catalyst particles (FCC1 and FCC2, in orange and purple, respectively), which have been subjected to different degrees of deactivation; i.e., fresh, two-step cyclic deactivated (CD), Mitchell impregnated-steam deactivated (MI). For comparison, data for an E-cat sample have been added to the diagram in black. The fluorescence mean intensities and their corresponding standard errors have been determined from the statistical analysis of at least 150 zeolitic domains in the confocal fluorescence microscopy images of the different batches of FCC catalyst samples. (Reproduced with permission from ref. 175, Copyright Macmillan Publishers, 2011).

Fig. 28