. 2015 Oct 5;44(20):7342–7370. doi: 10.1039/c5cs00376h

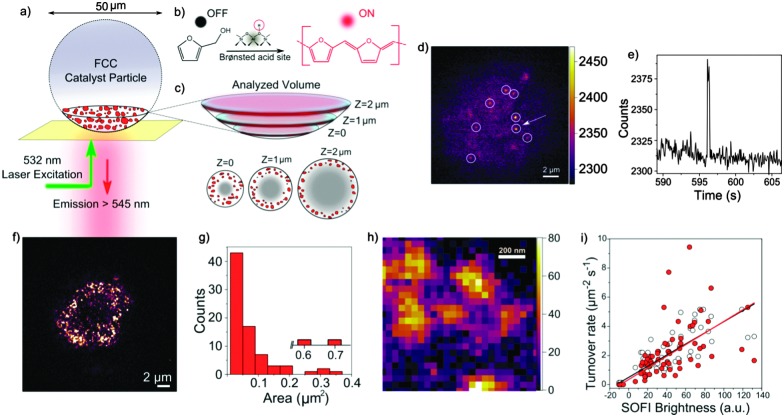
Fig. 30. (a) Schematic of the single-molecule fluorescence approach developed for visualizing reactivity within a single FCC catalyst particle, containing zeolite ZSM-5 domains, which are depicted in red. (b) Formation of the fluorescent products (red) upon oligomerization of non-fluorescent furfuryl alcohol (black) on a Brønsted acid site. (c) The geometry of the analyzed focal slices and denoted focal depths. The inner regions of the FCC catalyst particles, depicted in gray, were not included in the data analysis. (d) A wide-field fluorescence micrograph of an FCC particle recorded during the oligomerization of furfuryl alcohol. The white circles indicate localized fluorescence bursts originating from the fluorescent products. (e) A photo-trajectory of a representative single catalytic turnover, indicated with a white arrow in (d). (f) A cluster analysis of the zeolite ZSM-5 domains size within a single FCC catalyst particle has been applied on different SOFI images, in this case one taken at a focal depth of 1 μm. (g) Histogram of the zeolite domains size distribution originating from the SOFI image in (f). (h) SOFI image of a selected 1 μm2 region of interest indicating the fluorescent zeolite domains. (i) Catalytic turnover rate as a function of average brightness in the SOFI image, calculated for 65 individual zeolite domains. (Reproduced with permission from ref. 178, Copyright Wiley-VCH, 2015).

Fig. 30