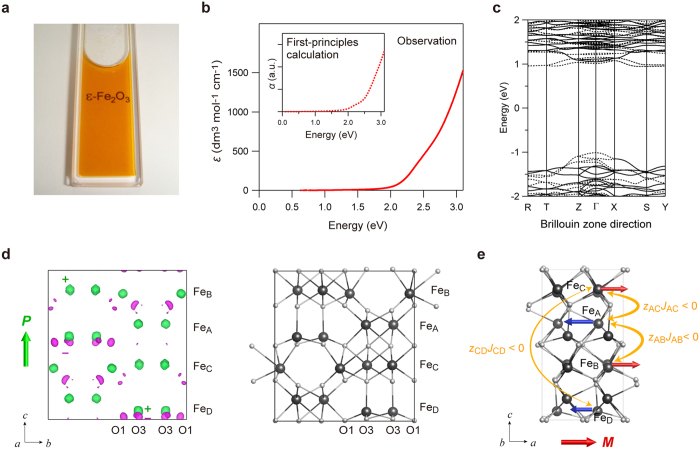
Figure 4. Transparency, optical band gap, and spontaneous electric polarization of ε-Fe2O3 by UV-vis absorption spectra measurement and first-principles calculation.
(a) Photograph of the colloidal solution of S-1020 nanocrystal with an average particle size of 8.2 nm, whose concentration is 1 × 10⁻² mol dm−3. The solution has a light orange color. (b) Observed UV-vis absorption spectrum of S-1020 colloidal solution shown by the molar absorption coefficient (ε). The inset shows the calculated optical spectrum obtained from the first-principles calculation. The left axis is the absorption coefficient (α). (c) The band structure of ε-Fe2O3 near the Fermi energy. Solid and dotted black lines indicate α and β spins, respectively. (d) The difference charge density map, which shows the difference between the charge density of ε-Fe2O3 and those of the neutral Fe and O atoms, obtained by the first-principles calculation (left). Green and magenta surfaces in the difference charge density map show the isosurface levels of +0.385e Å−3 and –0.252e Å−3, respectively. The green arrow shows that the spontaneous electric polarization (P) of ε-Fe2O3 is along the crystallographic c-axis. The crystal structure of ε-Fe2O3 (right). The grey and white balls in the crystal structure show the Fe and O atoms, respectively. (e) Sublattice magnetizations of FeA–FeD shown by the arrow on the crystal structure of ε-Fe2O3. Red and blue arrows on the Fe sites indicate the sublattice magnetizations. The yellow curved arrows express the zJ values, where z is the number of exchange pathways and J is the superexchange interaction constant, with antiferromagnetic superexchange interaction between the Fe sites (zAB JAB < 0, zAC JAC < 0, zCD JCD < 0), and the thickness of the arrows indicate that the magnitude of zJ is  . The red arrow below the crystal structure shows that the magnetic polarization (M) of ε-Fe2O3 is along the crystallographic a-axis.

