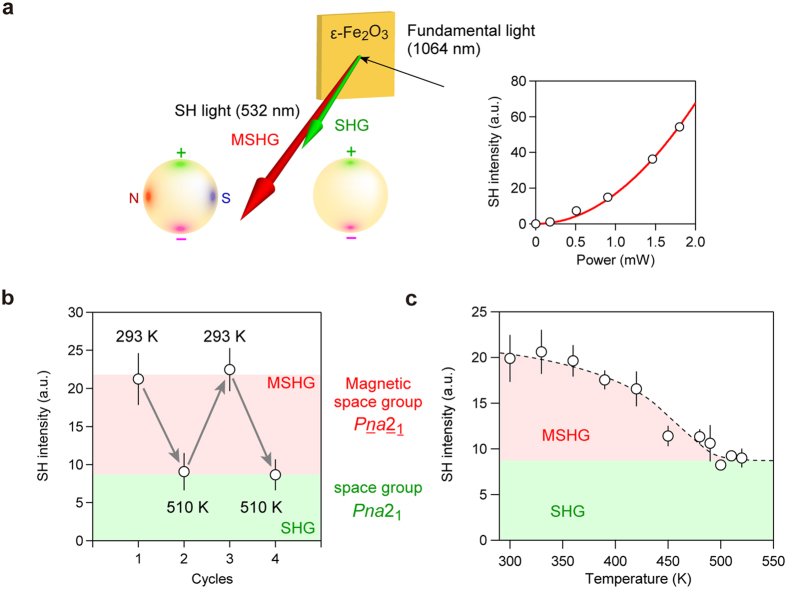
Figure 5. SHG and MSHG effects on ε-Fe2O3.
(a) The optical configuration of SHG and MSHG measurements. The orange square shows the position of the ε-Fe2O3 sample. A 1064-nm laser light (black arrow) irradiates the sample, and 532-nm SH output light is observed. The green arrow shows the SHG when the sample is in the magnetic-disordering state, while the red arrow shows the MSHG when the sample is in the magnetic-ordering state. The yellow spheres show the schematic illustrations of ε-Fe2O3 nanoparticle in the magnetic-ordering state with Pna21 magnetic space group (left) and the magnetic-disordering state with Pna21 space group (right). Only the electric polarization exists in the magnetic-disordering state, where the positive and negative charge are shown by green and magenta. In the magnetic-ordering state, the magnetic polarization appears perpendicular to the electric polarization, which is shown by the N-pole in red and S-pole in blue. The bottom right figure shows the SH intensity of S-1061 versus fundamental light intensity at room temperature. The red line represents the fitted curve based on SH intensity ∝ (fundamental light power)2. (b) Repetitive switching of SH intensity between SHG and MSHG by changing the temperature between above and below TC. (c) SH intensity versus temperature plot of S-1061.

