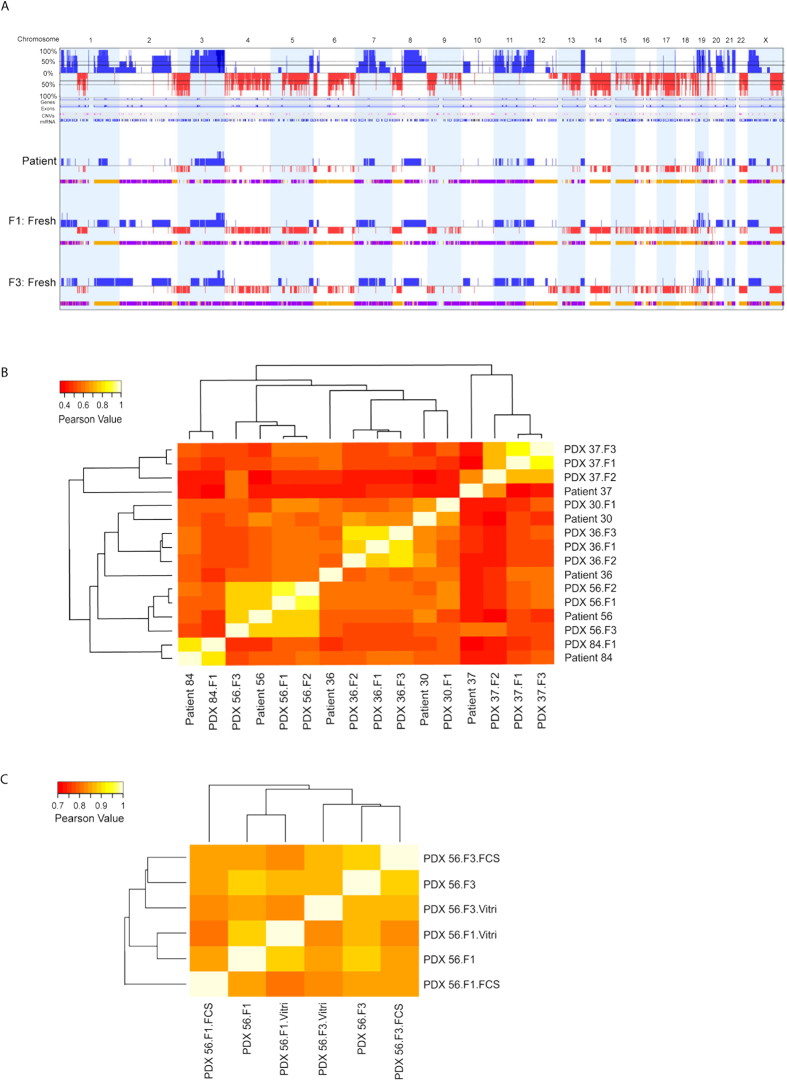
Figure 4. Copy number analysis of ovarian cancer patient tumours and their matched PDX tumours using genome-wide SNP array.
(A) CNA plots represented the copy number alterations between the primary tumour of patient 56, PDX tumour after first engraftment (F1) and PDX tumour after 3rd engraftment (F3). Genomic gain is indicated in blue and genomic loss is indicated in red over all chromosomes. In the upper CNA plot, the average genomic alteration of all three samples is presented in a similar manner (blue: amplification and red: loss). Below each CNA plot of each sample, the bar with colors represents the allelic events (yellow for loss of heterozygosity (LOH); purple for allelic imbalance). (B) Quantitative CNA concordance analysis of tumours of patients and their corresponding PDXs by hierarchical clustering. (C) Quantitative CNA concordance analysis of engrafted tumours of patient 56 after preservation using both methods compared to freshly propagated tumours by hierarchical clustering. Note that the scale bar of the Pearson Value is different for (B and C).

