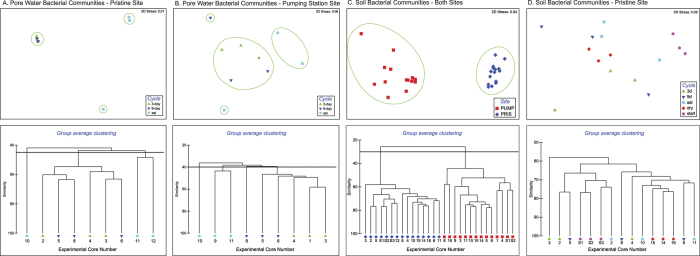
Figure 6. NMDS of bacterial communities in pore water and soil based on Bray-Curtis similarity.

Green ellipses indicate group average clustering of samples for the similarity threshold shown in the dendrogram below. Panels (A,B) show samples subjected to three experimental dry-rewetting cycles (3-day, 9-day and saturated) taken at the end of the experiment (Final Cycle). Most communities subjected to 3-day and 9-day dry-rewetting cycles fall within a cluster, while bacterial communities in continuously saturated cores are distinct from the 3-day and 9-day cycles, and at times distinct from other saturated cores, indicating high variance among communities in saturated cores. Panels (C,D) show soil bacterial communities. Soil communities in the pristine site (PRIS) are distinct from communities in the pumping station site (PUMP) (Panel (C)), while within the prisitne site, there is no clear evidence of an effect of dry-rewetting cycle (Panel (D)). A similar pattern is observed in the pumping station site (data not shown).
