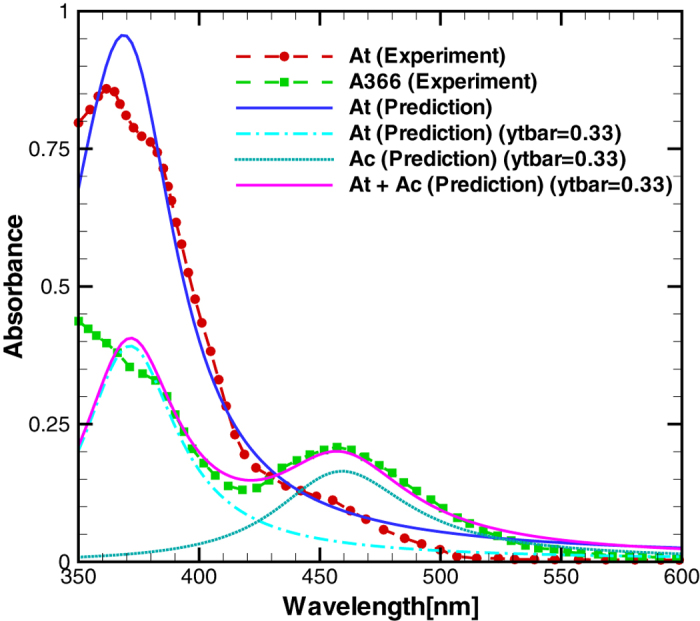
Figure 3. Comparison of absorption spectra of the azobenzene material between the numerical prediction described in the Results section and experiments40 for different trans and cis states.

At denotes trans absorption and Ac denotes cis absorption.

At denotes trans absorption and Ac denotes cis absorption.