. 2015 Aug 13;4:e07789. doi: 10.7554/eLife.07789

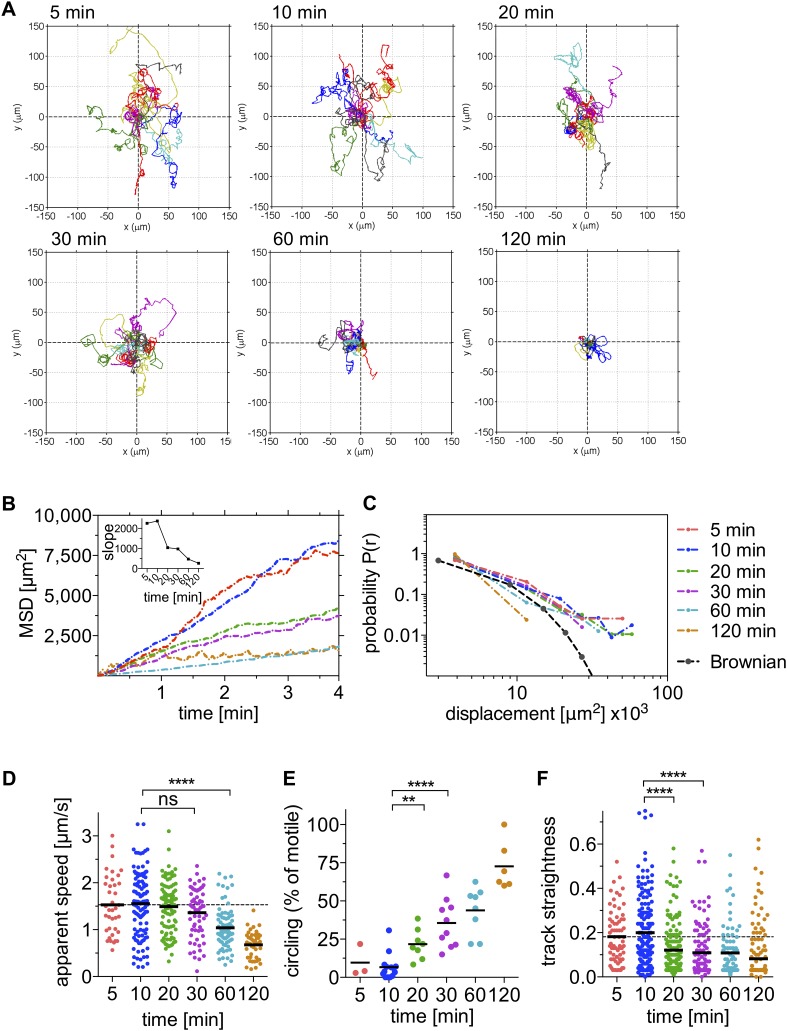
Figure 1. Sporozoite motility is increasingly constrained over time and is not well described by a Brownian walk.

Time-lapse microscopy of sporozoites was started at the indicated time points after intradermal inoculation and 4 min long videos were acquired. See Video 1 for a representative time course. (A) Meandering and linearly moving sporozoites were manually tracked using Imaris software and for each time point 11 representative reconstructed tracks were plotted to a common origin to visualize parasite dispersal over time. For panels BF, a varying number of videos were processed for each time point after inoculation: 5 min (2 videos/37 tracks), 10 min (14 videos/179 tracks), 20 min (7 videos/95 tracks), 30 min (9 videos/129 tracks), 60 min (8 videos/77 tracks), and 120 min (7 videos/67 tracks). (B) Mean square displacement (MSD) of sporozoite tracks over the duration of the 4 min video, at indicated time points after inoculation, with inset showing the slope obtained through linear regression fitting of MSD curves. (C) The probability distribution P(r) of squared final sporozoite displacements at the end of the 4-min videos. For comparison, the distribution of a Brownian walk is shown. (D) Apparent speed of gliding sporozoites. Bars represent mean values and dashed line marks the mean value at 5 min after inoculation. (E) The percentage of sporozoites gliding continuously in the same circle throughout the duration of the video, showing an increasing proportion of exclusively circling sporozoites at later time points. Every data point represents one video. (F) Straightness of sporozoite tracks, the ratio of displacement to track length of both meandering and linearly moving, as well as continuously circling sporozoites. Bars represent mean values and dashed line marks the mean value at 5 min after inoculation.

DOI: http://dx.doi.org/10.7554/eLife.07789.004

Figure 1.

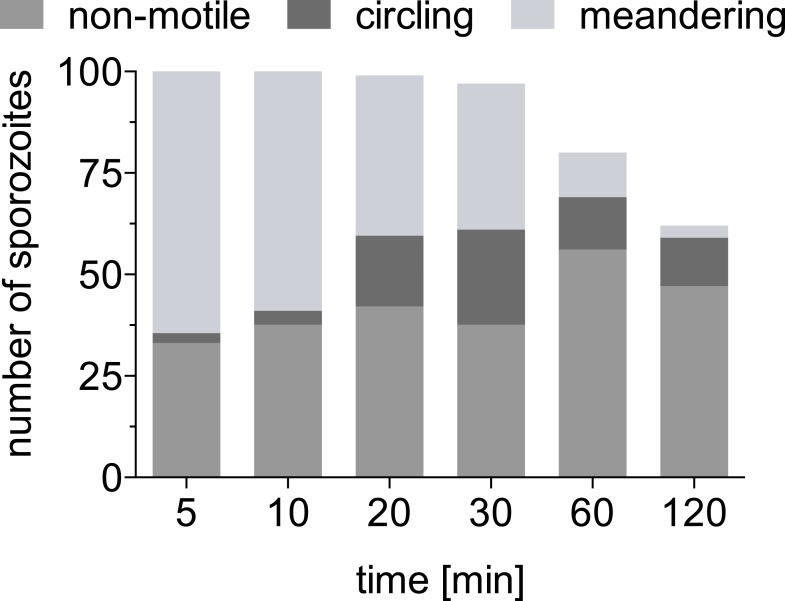
Figure 1—figure supplement 1. Absolute number of sporozoites exhibiting different motility patterns over time.

Figure 1—figure supplement 1.

Data from two complete time courses were combined and shown is the absolute number of total sporozoites at the inoculation site at each time point and of these, the number that are non-motile, continuously circling and meandering.
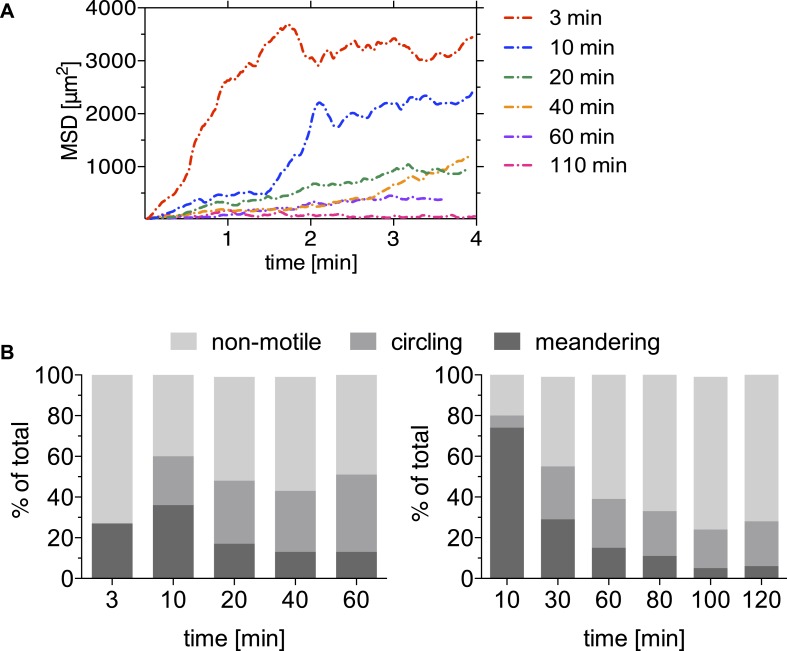
Figure 1—figure supplement 2. Motility is increasingly constrained over time after sporozoite inoculation by mosquito bite.

Figure 1—figure supplement 2.

A mosquito infected with PbmCherry sporozoites was allowed to probe on the ear pinnae of an anethesized mouse and the first 4-min time-lapse was acquired 3 min after the proboscis was seen in the field of view. The bite site was followed for a total of 110 min, and images were acquired at the indicated times. Data shown was obtained from two biological replicate time courses. (A) Sporozoites were manually tracked using Imaris software to compare the MSD of sporozoites at 3 min (38 tracks), 10 min (30 tracks), 20 min (73 tracks), 40 min (53 tracks), 60 min (61 tracks), and 110 min (1 video only/21 tracks) after mosquito bite. (B) Proportion of manually counted sporozoite motility patterns are shown as percent of total sporozoites. Data from two independent experiments are shown.
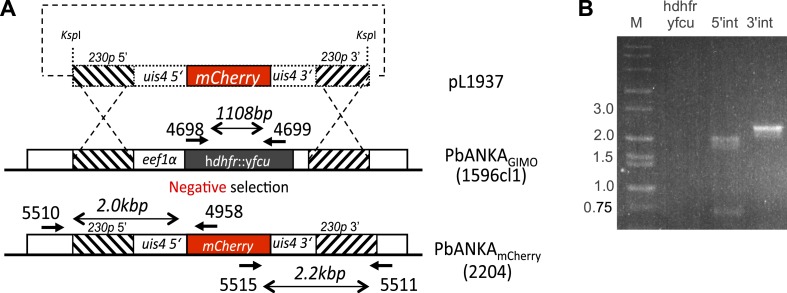
Figure 1—figure supplement 3. Generation and verification of a marker-free Plasmodium berghei line expressing mCherry under control of the uis4 promoter, using GIMO transfection.

Figure 1—figure supplement 3.

(A) Schematic representation of the introduction of an mCherry-expression cassette under the control of uis4-promoter into the GIMOPbANKA mother line 1596cl1. Transfection construct pL1937 containing the uis4-mCherry-3ʹpbdhfr cassette is integrated into the modified P. berghei 230p locus containing the hdhfr::yfcu selectable marker cassette (black box) by double cross-over homologous recombination at the target regions (hatched boxes). Negative selection with 5-FC selects for parasites that have the mCherry reporter introduced into the genome and the hdhfr::yfcu marker removed (PbANKAmCherry line 2204). Location of primers used for PCR analysis and sizes of PCR products are shown. (B) Diagnostic PCRs confirm integration as expected in PbANKAmCherry line 2204 clone 5, shown by the absence of the hdhfr::yfcu marker (amplification of hdhfr::yfcu with primers 4698/4699) and correct 5′- and 3′-integration PCR product sizes (primer pairs 5510/4958 and 5515/5511, respectively). See Supplementary file 1 for all primer sequences.