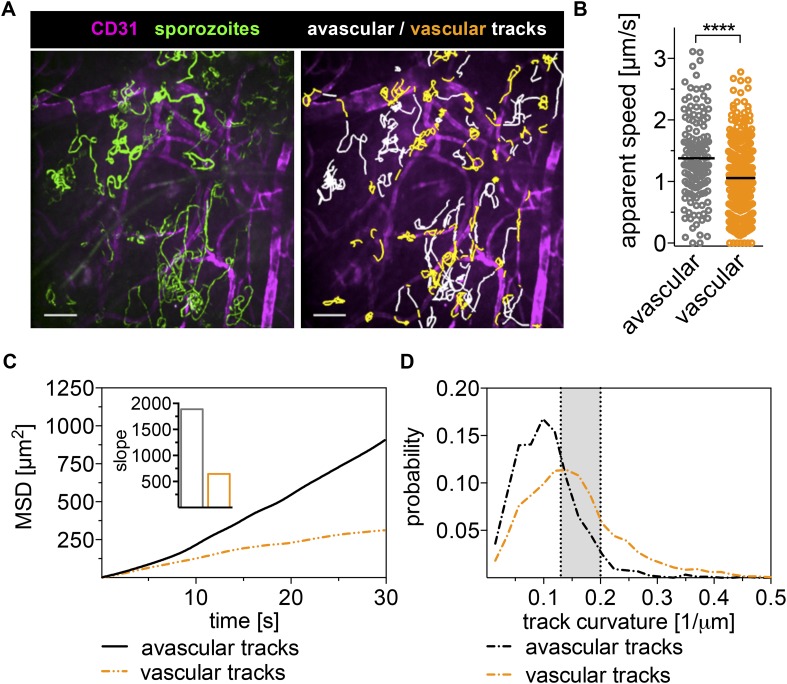
Figure 2. Sporozoites recognize dermal blood vessels.
Time-lapse microscopy of sporozoites, 10 min after intradermal inoculation, and CD31-labeled vascular endothelia. (A) Maximum intensity projection over 240 s shows trajectories of moving sporozoites (green) and blood vessels (far red) (see Video 2). Sporozoites were manually tracked using Imaris software and tracks overlapping with CD31+ vessels are colored orange, while tracks in between CD31+ vessels are white. Scale bar, 25 μm. For panels B–D, 18 videos were processed and 313 tracks of sporozoites moving in proximity of blood vessels and 163 tracks of sporozoites moving in between blood vessels were generated. (B) Apparent speed, with lines representing mean values, reveals a decrease in gliding speed once sporozoites are in proximity of blood vessels. (C) MSD plot shows significant decrease in displacement of sporozoite tracks in the vicinity of vasculature. Inset shows decreased slope of perivascular tracks obtained from linear regression fitting (R2 values: Rperivascular = 0.9884; Ravascular = 0.9924). (D) Extrapolated track curvature, as defined by 1/radius (where the radius is measured in μm), of perivascular and avascular sporozoite tracks. Kolmogorov–Smirnov two-sample test was performed and found difference of perivascular and avascular curvature highly significant (p = 10−57). Shaded area shows range of curvature of dermal capillaries (Yen and Braverman, 1976; Braverman, 1997).


