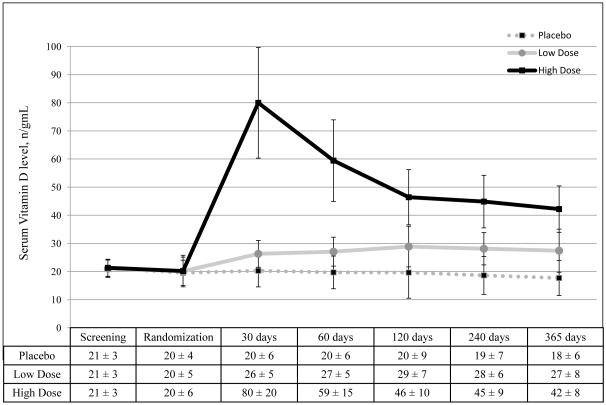
Figure 2. Serum Vitamin D Levels by Treatment Assignment.
Serum vitamin D levels were summarized using the mean and standard deviation, and compared across treatment arms by analysis of variance, with correction of p-values to control the false discovery rate using the Benjamini and Hochberg method. Vitamin D levels were not significantly different across treatment groups at the screening (p=0.89) and randomization (p=0.89) visits. At all subsequent visits, serum vitamin D levels were significantly different (p<0.001) across all three treatment arms. Pairwise comparisons likewise showed p-values <0.001. To convert 25(OH)D from ng/mL to mmol/L, multiply values by 2.496.

