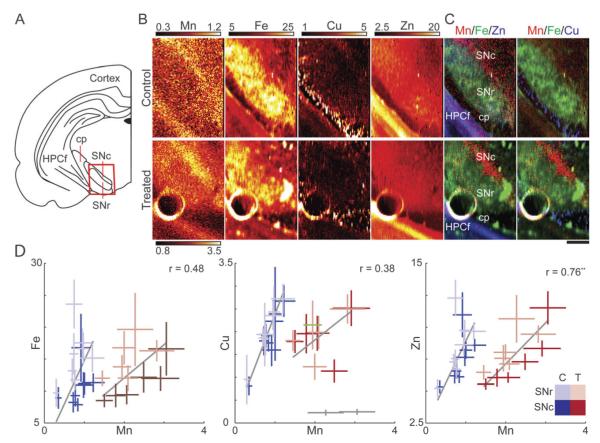
Fig. 1.
Tissue level XRF analysis of the SN. (A) Schematic of the coronal plane illustrating the substantia nigra (SN). The substantia nigra pars reticulata (SNr) separates the hippocampal formation (HPCf) and the substantia nigra pars compacta (SNc), which accumulates Mn. The red box corresponds to the regions featured in B. For clarity, the cerebral peduncle (cp) is also labeled. (B) XRF images of the SNr and the SNc, identifiable by the strong Fe and Mn signals respectively. The high Zn content to the lower left is due to the CA3 layer of the HPCf. Maximum scale for Mn in control is one-third that of the Mn treated sample for viewing purposes. (C) Tri-colored plots demonstrate the highest Mn accumulation adjacent to the SNr in both control and treated animals. Brain areas of SNr, SNc, caudal peduncle (cp), and HPCf are indicated on the plot. (D) Scatter plots of average metal concentration versus Mn for the SNc (dark tint) and SNr (light tint) for control (blue, n = 16 points) and Mn treated animals (red, n = 12 points). Gray lines indicate the best fit of the data weighted according to standard deviation of the individual data points (bars). Grayed data points identified as outliers and not considered for fitting purposes. Pearson correlation coefficient (r) and significance level (**p < 0.01) are displayed for metal/Mn of treated samples (Table S1, ESI‡). All numbers given are in μg g−1.

