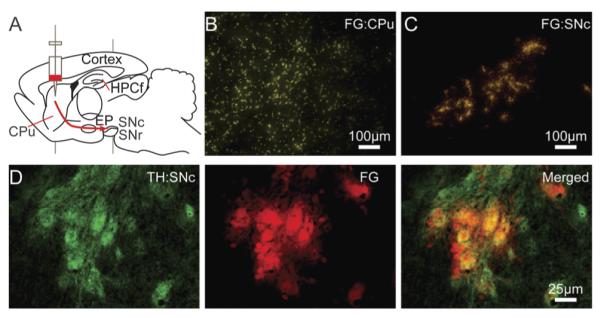
Fig. 2.

FG labeling of DA cells. (A) Diagram of a sagittal plane of the rodent brain with the approximate location of FG injection. The red arrow gives an approximate route of the nigra-neostriatum pathway. Injection into the CPu (B) results in uptake into axonal terminals and transport to DA cell bodies of the SNc (C). Scale bars represent a length of 100 μm (10 × objective). (D) Tyrosine hydroxylase IHC staining (green) reveals a more dense population of DA cells in the SNc than FG tracer (red), however all FG accumulating cells are positive for TH verified by two color image. Scale bars represent a length of 25 μm (40 × objective).
