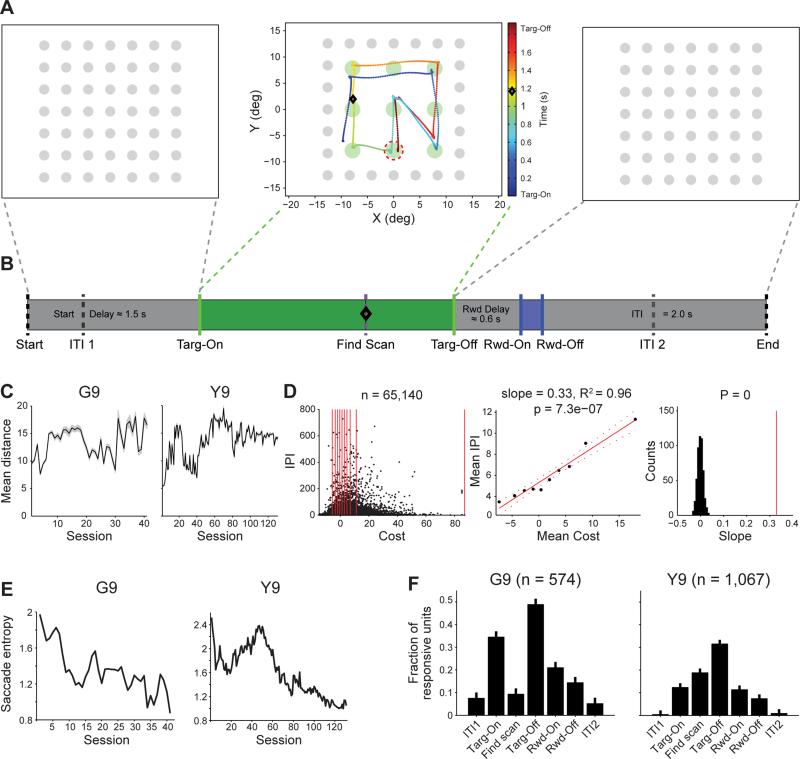
Figure 1. Behavior and Neural Responses during Task Periods.
(A) Sample sequence of viewing screens in single trial. Gray targets appear on black background (left). The monkey scans green targets until a randomly chosen target is captured (middle). Then, the green targets grid turns off (right). Black diamond indicates time (on color bar) and position (on grid) of monkey's gaze when the target (red dashed circle) became bated with reward (not signaled to the monkey).
(B) Sequence of task events, with mean of variable duration (Start Delay, Delay Scan, Reward Scan, and Reward Delay) or fixed duration. Dashed lines indicate events not observable by the monkey. ITI1 (0.5 s after trial start) and ITI2 (1 s before trial end) were used to examine neural responses immediately prior to and after each trial, respectively.
(C) Mean (± SEM) saccade distance (from Targ-On to Targ-Off) for each session in G9 (left) and Y9 (right).
(D) Correlation between trial-by-trial cost and inter-pattern interval (IPI, number of intervening trials between two trials with the same stereotyped scan pattern; see Supplemental Information). All trials containing any of the most frequent sequences in G9 and Y9 are shown as dots in the left panel. Note that the distribution appears skewed because the density of values less than zero cannot be accurately represented; the distribution is centered around zero with a median cost value of 1.2. Middle panel shows means for 10 bins containing the same number of trials (bin edges indicated by red lines in left) and line fit. Right panel shows results of shuffling the IPI and cost 500 times and computing the slope for each. Actual slope (middle) indicated by red line. No shuffled slope was greater than actual.
(E) Entropy of target-to-target transition probabilities across training sessions.
(F) The mean fraction (± SEM) of units with significant responses to task events across sessions (see Supplemental Information).
See also Figure S1.

