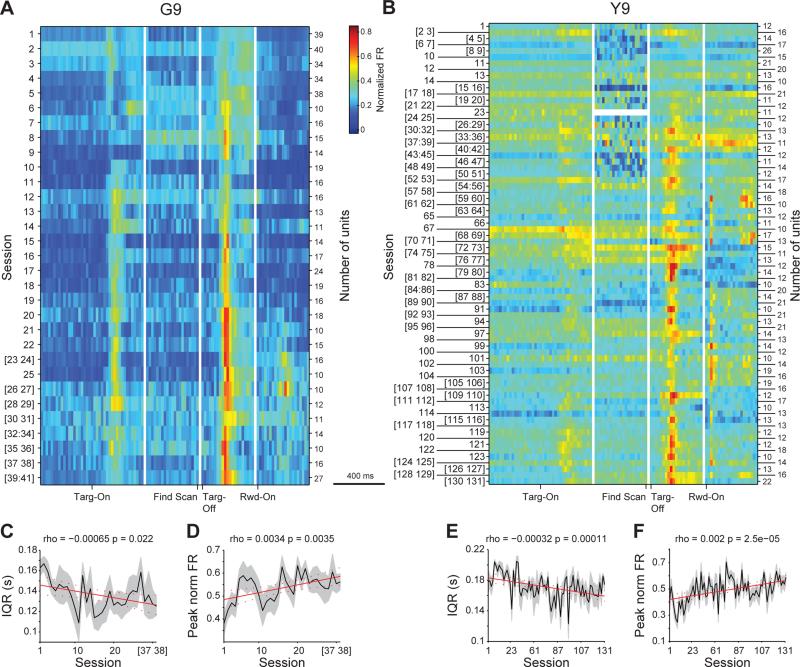
Figure 2. Changes in Activity Patterns of Striatal Neurons across Learning.
(A and B) All units recorded in monkey G (A) and monkey Y (B). Activity of each unit was normalized to minimum-to-maximum (0-1) scale. Units were binned across sessions, if necessary, so that there were at least 10 units in each bin. Each row shows the average activity of all units (20 ms bins, color indicates normalized firing rate) in that session bin across the following peri-event windows (divided by vertical white lines): Targ-On (−0.4 to 0.4 s), Find Scan (−0.4 to 0 s), Targ-Off (0 to 0.4 s), and Rwd-On (0 to 0.4 s; only for correct trials). (C and E) Response sharpness (mean ± SEM) in the Targ-Off window, as measured by IQR, increases across sessions (binned as in A) in monkeys G (C) and Y (E). Regression lines (red) shown with confidence intervals (red dashed).
(D and F) Average peak firing (± SEM) of all units across sessions in the Targ-Off window for monkeys G (D) and Y (F), calculated as the mean normalized firing rate in the center two quartiles around the median firing time.
See also Figure S2.

