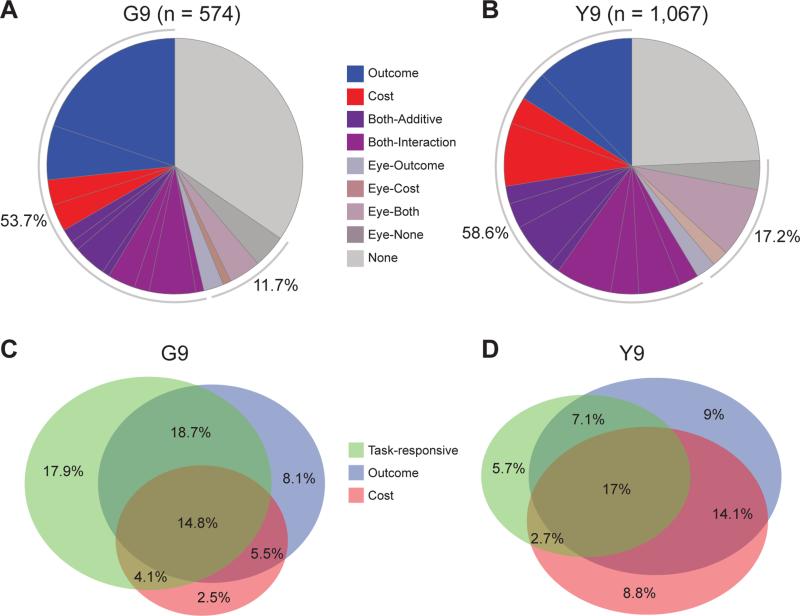
Figure 3. Response Categories of CN Units.
(A and B) Percentage of units categorized as Outcome, Cost, and Both (Additive and Interaction types) units recorded in monkeys G (A) and Y (B) across sessions. Signs (“+”, “−”, or combination) indicate the sign of the coefficient in the regression (for Both units, signs for Outcome and Cost shown, respectively, toward perimeter and towards center). Units correlated with eye movement times (Eye) are not further broken down into subtypes based on the sign of the coefficient.
(C and D) Venn diagrams showing percentage of each unit type. Eye units were excluded. Overlap of Outcome and Cost units represents Both units.
See also Figure S3.

