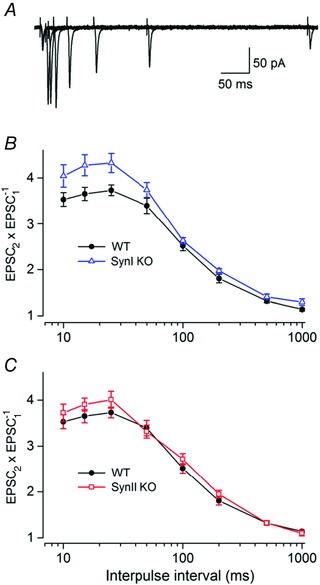
Figure 2. Paired‐pulse facilitation .

A, overlapping traces from a representative TC neuron from a wild‐type (WT) mouse to stimulation at different interpulse intervals. B, comparisons of PPF of neurons from SynI KO (n = 17) and WT mice (n = 16). Averaged PP ratios (EPSC2/EPSC1) at different interpulse intervals (mean ± SEM). The PPF in SynI KO was significantly stronger than in the WT at the intervals of 15 and 25 ms (P < 0.05). C, comparisons of PPF of neurons from SynII KO (n = 17) and WT mice (n = 16). The data for the WT are the same in B and C. The amplitude of the EPSCs to single pulse stimulation: −52 ± 7 pA (WT), −47 ± 5 pA (SynI KO), −50 ± 6 pA (SynII KO).
