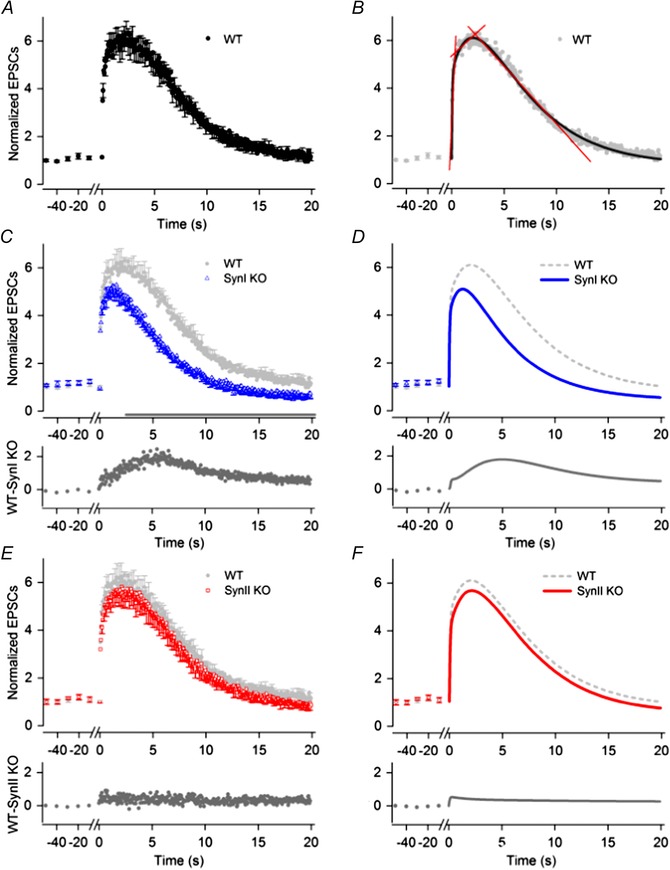
Figure 4. Facilitation in WT, Syn I KO and Syn II KO mice during 20 Hz pulse‐train stimulation .

A, C and E, normalized responses of TC neurons to the pulse‐train stimulation (mean and SEM) for WT (A; n = 9), SynI KO (C; n = 10) and SynII KO (E; n = 8). Before each train, responses to a series of control stimuli at 0.1 Hz were given (only last five shown). To improve readability, error bars are indicated for only every third data point. The amplitude of the EPSCs to single pulse stimulation: −49 ± 8 pA (WT), −57 ± 10 pA (SynI KO), −45 ± 9 pA (SynII KO). In C and E, the WT response is plotted in light grey to simplify comparisons between the WT and the KO. Below the plots of the data points, the difference between the responses of the WT and the KO are plotted. B, D and F, curves fitted to the data points. B, three different phases of changes in response amplitudes were distinguished: an initial with rapid increase, a second with considerably slower increase to maximum, and a final phase with slow decrease. Straight lines (in red) were fitted to the normalized response in each phase. The slope of the lines indicates the rate of response change in the respective phases (values in text). A three‐phase decay function (curve in black) gave good fit to the data supporting the existence of three phases of the facilitation. D, curves (in blue) obtained by optimal fit of a triple exponential function to the data for Syn I KO (see Methods). F, corresponding curve (in red) obtained by optimal fit of the exponential function to the data for SynII KO.
